Identifiable effects on public health which may be expected from the presence of a pollutant in ambient air, e.g. Heart Attacks
Submitted by Norm Roulet on Mon, 06/07/2010 - 11:00.
As a result of old science, politics and industry dominating energy, health and environmental planning and development of Cleveland, Northeast Ohio, Ohio and America, citizens here must confront the realities of too much pollution in our air today, with certainty of growing air pollution worldwide in the years ahead. As such, the United States Environmental Protection Agency's 2009 Integrated Science Assessment for Particulate Matter finds our pollution causes cardiovascular and respiratory problems and death... topping a long list of cumulative harm pollution causes people and society. Integrated Science Assessment for Particulate Matter forms the scientific foundation for the review of the primary (health-based) and secondary (welfare-based) National Ambient Air Quality Standards (NAAQS) for particulate matter (PM) in America, and "accurately reflects “the latest scientific knowledge useful in indicating the kind and extent of identifiable effects on public health which may be expected from the presence of [a] pollutant in ambient air”".
As I've long written on realNEO, Northeast Ohio has a pollution crisis and does a poor job or monitoring our pollution, putting citizens' lives in danger. How much in danger is the subject of this lengthy EPA analysis. In short, you are certainly being harmed greatly by the high levels of PM clearly released into the air in Northeast Ohio, especially near major roadways and coal burning facilities that are source points, like Mittal and MCCO. For example: "Epidemiologic studies that examined the effect of PM 2.5 on cardiovascular emergency department (ED) visits and hospital admissions reported consistent positive associations (predominantly for ischemic heart disease [IHD] and congestive heart failure [CHF]), with the majority of studies reporting increases ranging from 0.5 to 3.4% per 10 μg/m3 increase in PM 2.5".
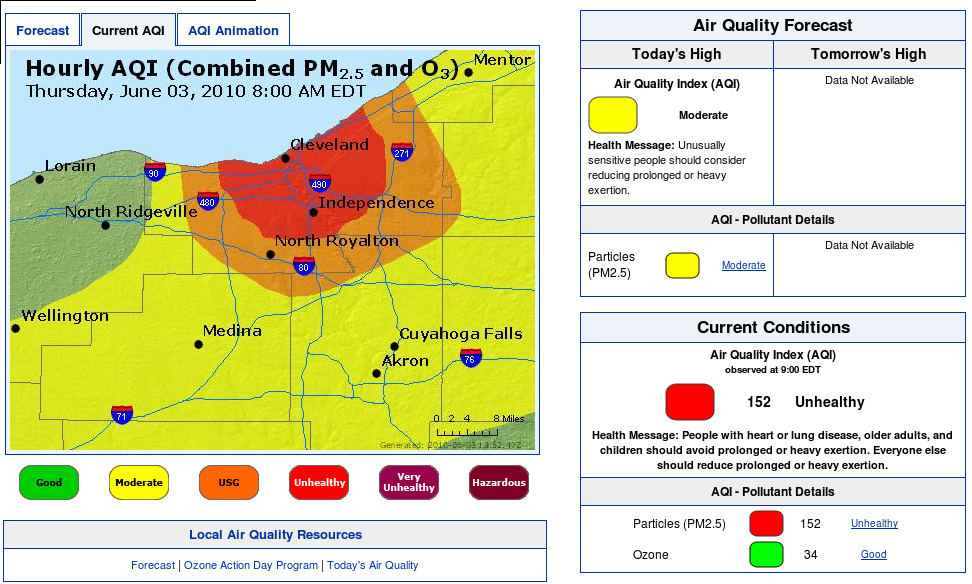
On Memorial Day, 2010, pollution monitors in the Tremont area of Cleveland reported PM 2.5 readings in excess of 317 μg/m3 - nearly 6 times the EPA ambient standard 24 hour concentration of 65 ug per cubic meter Primary and Secondary... more than 21X the annual mean standard of 15 ug per cubic meter... does that mean sleeping residents were 15-90+% more likely to have episodes requiring cardiovascular emergency department (ED) visits and hospital admissions, and within what time frame?
If that reality isn't front and center in your brain, perhaps the pollution has taken control of your mind... you need to read this report - note huge file sizes: Integrated Science Assessment for Particulate Matter (Full Report) (2228 pp, 105.4 MB) - Integrated Science Assessment for Particulate Matter (Final Report Without Annexes) (PDF) (1071 pp, 48 MB).
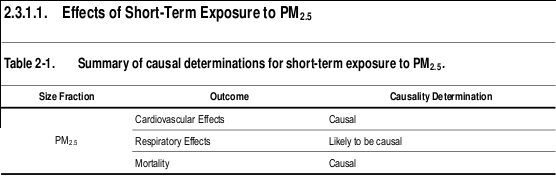
I've summarized and included below some important highlights of this 2000+ page report... like findings related to Table 2-1 above - Summary of causal determinations for short-term exposure to PM 2.5 - concluding, among many causal things, "the collective evidence from epidemiologic, controlled human exposure, and toxicological studies is sufficient to conclude that a causal relationship exists between short-term exposures to PM 2.5 and cardiovascular effects." In other words, our air pollution is as serious as a heart attack.
One especially relevant finding I mined from page 119:
Spatial variability in source contributions across urban areas is an important consideration in
assessing the likelihood of exposure error in epidemiologic studies relating health outcomes to
sources. Concepts similar to those for using ambient concentrations as surrogates for personal
exposures apply here. Some source attribution studies for PM 2.5 indicate that intra-urban variability
increases in the following order: regional sources (e.g., secondary SO 4 2– originating from EGUs)
< area sources (e.g., on-road mobile sources) < point sources (e.g., metals from stacks of smelters).
Although limited information was available for PM 10-2.5 , it does indicate a similar ordering, but
without a regional component (resulting from the short lifetime of PM 10-2.5 compared to transport
times on the regional scale). More discussion on source contributions to PM is available in
Section 3.6.
That makes living near point sources (e.g., metals from stacks of smelters) especially significant. Anyone in Cleveland live near major PM 2.5 point sources? Here are some other highlights to think about:
"The degree of spatial variability in PM was likely to be region-specific and strongly influenced by local sources and meteorological and topographic conditions (p116)." "In general, PM 2.5 has a longer atmospheric lifetime than PM 10-2.5 . As a result, PM 2.5 is more homogeneously distributed than PM 10-2.5 , whose concentrations more closely reflect proximity to local sources (Section 3.5.1.2)". "UFPs are not measured as part of AQS or any other routine regulatory network in the U.S. Therefore, information about the spatial variability of UFPs is sparse; however, their number concentrations are expected to be highly spatially and temporally variable. This has been shown on the urban scale in studies in which UFP number concentrations drop off quickly with distance from roads compared to accumulation mode particle numbers."
"Correlations between PM and gaseous copollutants, including SO 2 , NO 2 , carbon monoxide (CO) and O 3 , varied both seasonally and spatially between and within metropolitan areas (Section 3.5.3)." "The correlation between daily maximum 8-h avg O 3 and 24-h avg PM 2.5 showed the highest degree of seasonal variability with positive correlations on average in summer (avg = 0.56) and negative correlations on average in the winter (avg = -0.30). During the transition seasons, spring and fall, correlations were mixed but on average were still positive. PM 2.5 is both primary and secondary in origin, whereas O 3 is only secondary. Photochemical production of O 3 and secondary PM in the planetary boundary layer (PBL) is much slower during the winter than during other seasons. Primary pollutant concentrations (e.g., primary PM 2.5 components, NO and NO 2 ) in many urban areas are elevated in winter as the result of heating emissions, cold starts and low mixing heights. O 3 in the PBL during winter is mainly associated with air subsiding from above the boundary layer following the passage of cold fronts, and this subsiding air has much lower PM concentrations than are present in the PBL. Therefore, a negative association between O 3 and PM 2.5 is frequently observed in the winter. During summer, both O 3 and secondary PM 2.5 are produced in the PBL and in the lower free troposphere at faster rates compared to winter, and so they tend to be positively correlated."
"The federal reference methods (FRMs) for PM 2.5 and PM 10 are based on criteria outlined in the Code of Federal Regulations. They are, however, subject to several limitations that should be kept in mind when using compliance monitoring data for health studies. For example, FRM techniques are subject to the loss of semi-volatile species such as organic compounds and ammonium nitrate (especially in the West). Since FRMs based on gravimetry use 24-h integrated filter samples to collect PM mass, no information is available for variations over shorter averaging times from these instruments. However, methods have been developed to measure real-time PM mass concentrations. Real-time (or continuous and semi-continuous) measurement techniques are also available for PM species, such as particle into liquid sampler (PILS) for multiple ions analysis and aerosol mass spectrometer (AMS) for multiple components analysis (Section 3.4.1). Advances have also been achieved in PM organic speciation. New 24-h FRMs and Federal Equivalent Methods (FEMs) based on gravimetry and continuous FEMs for PM 10-2.5 are available. FRMs for PM 10-2.5 rely on calculating the difference between co-located PM 10 and PM 2.5 measurements while a dichotomous sampler is designated as an FEM."
"Results of receptor modeling calculations indicate that PM 2.5 is produced mainly by combustion of fossil fuel, either by stationary sources or by transportation. A relatively small number of broadly defined source categories, compared to the total number of chemical species that typically are measured in ambient monitoring source receptor studies, account for the majority of the observed PM mass. Some ambiguity is inherent in identifying source categories. For example, quite different mobile sources such as trucks, farm equipment, and locomotives rely on diesel engines and ancillary data is often required to resolve these sources. A compilation of study results shows that secondary SO 4 2– (derived mainly from SO 2 emitted by Electricity Generating Units [EGUs]), NO 3 – (from the oxidation of NO x emitted mainly from transportation sources and EGUs), and primary mobile source categories, constitute most of PM 2.5 (and PM 10 ) in the East. PM 10-2.5 is mainly primary in origin, having been emitted as fully formed particles derived from abrasion and crushing processes, soil disturbances, plant and insect fragments, pollens and other microorganisms, desiccation of marine aerosol emitted from bursting bubbles, and hygroscopic fine PM expanding with humidity to coarse mode. Gases such as HNO 3 can also condense directly onto preexisting coarse particles. Suspended primary coarse PM can contain Fe, Si, Al, and base cations from soil, plant and insect fragments, pollen, fungal spores, bacteria, and viruses, as well as fly ash, brake lining particles, debris, and automobile tire fragments. Quoted uncertainties in the source apportionment of constituents in ambient aerosol samples typically range from 10 to 50%. An intercomparison of source apportionment techniques indicated that the same major source categories of PM 2.5 were consistently
identified by several independent groups working with the same data sets. Soil-, sulfate-, residual oil-, and salt-associated mass were most clearly identified by the groups. Other sources with more ambiguous signatures, such as vegetative burning and traffic-related emissions were less consistently identified."
"Spatial variability in source contributions across urban areas is an important consideration in assessing the likelihood of exposure error in epidemiologic studies relating health outcomes to sources. Concepts similar to those for using ambient concentrations as surrogates for personal exposures apply here. Some source attribution studies for PM 2.5 indicate that intra-urban variability increases in the following order: regional sources (e.g., secondary SO 4 2– originating from EGUs) < area sources (e.g., on-road mobile sources) < point sources (e.g., metals from stacks of smelters). Although limited information was available for PM 10-2.5 , it does indicate a similar ordering, but without a regional component (resulting from the short lifetime of PM 10-2.5 compared to transport times on the regional scale). More discussion on source contributions to PM is available in Section 3.6."
As I have previously reported on realNEO, "Short-Term Exposure To Fine Particle Air Pollution Can Drive Up High Blood Pressure, Raise Risk Of Heart Attack", "A Healthy Brain Is Essential For Successful, Healthy Aging: Air Pollution Contributes To The Risk Of Alzheimer’s-Type Disease" and, in "Cover letter to President Obama from the 2008–2009 Annual Report of the President’s Cancer Panel, April 2010", surface: "In 2009 alone, approximately 1.5 million American men, women, and children were diagnosed with cancer, and 562,000 died from the disease. With the growing body of evidence linking environmental exposures to cancer, the public is becoming increasingly aware of the unacceptable burden of cancer resulting from environmental and occupational exposures that could have been prevented through appropriate national action."
In summary conclusion, Integrated Science Assessment for Particulate Matter finds, suspects and is investigating causal relationships between our air pollution and all the following concerns for our community:
2.6. Summary of Health Effects and Welfare Effects
Causal Determinations
This chapter has provided an overview of the underlying evidence used in making the causal determinations for the health and welfare effects and PM size fractions evaluated. This review builds upon the main conclusions of the last PM AQCD (U.S. EPA, 2004, 056905):
- "A growing body of evidence both from epidemiological and toxicological studies supports the general conclusion that PM 2.5 (or one or more PM 2.5 components), acting alone and/or in
- “A much more limited body of evidence is suggestive of associations between short-term (but not long-term) exposures to ambient coarse-fraction thoracic particles and various mortality and morbidity effects observed at times in some locations. This suggests that PM 10-2.5 , or some constituent component(s) of PM 10-2.5 , may contribute under some circumstances to increased human health risks with somewhat stronger evidence for associations with morbidity (especially respiratory) endpoints than for mortality.” (pg 9-79 and 9-80)
- "Impairment of visibility in rural and urban areas is directly related to ambient concentrations of fine particles, as modulated by particle composition, size, and hygroscopic characteristics, and by relative humidity.” (pg 9-99)
- “Available evidence, ranging from satellite to in situ measurements of aerosol effects on incoming solar radiation and cloud properties, is strongly indicative of an important role in climate for aerosols, but this role is still poorly quantified.” (pg 9-111)
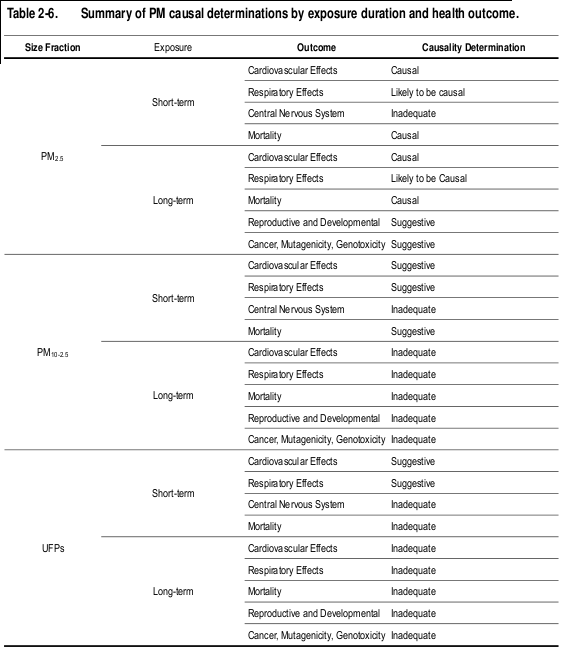
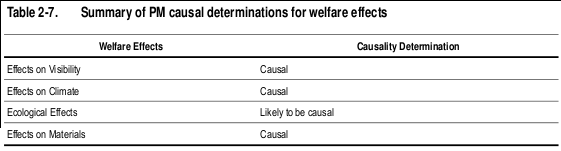
The evaluation of the epidemiologic, toxicological, and controlled human exposure studies published since the completion of the 2004 PM AQCD have provided additional evidence for PM-related health effects. Table 2-6 provides an overview of the causal determinations for all PM size fractions and health effects. Causal determinations for PM and welfare effects, including visibility, climate, ecological effects, and materials are included in Table 2-7. Detailed discussions of the scientific evidence and rationale for these causal determinations are provided in the subsequent chapters of this ISA.
As explained in its introduction, the focus of this 2228 page Integrated Science Assessment for Particulate Matter is on scientific evidence that is most relevant to the following questions that have been taken directly from the Integrated Review Plan:
- Has new information altered the body of scientific support for the occurrence of health effects following short- and/or long-term exposure to levels of fine and thoracic coarse particles found in the ambient air?
- Has new information altered conclusions from previous reviews regarding the plausibility of adverse health effects associated with exposures to PM 2.5 , PM 10 , PM 10-2.5 , or alternative PM indicators that might be considered?
- What evidence is available from recent studies focused on specific size fractions, chemical components, sources, or environments (e.g., urban and non-urban areas) of PM to inform our understanding of the nature of PM exposures that are linked to various health outcomes?
- To what extent is key scientific evidence becoming available to improve our understanding of the health effects associated with various time periods of PM exposures, including not only short-term (daily or multi-day) and chronic (months to years) exposures, but also peak PM exposures (<24 hours)? To what extent is critical research becoming available that could improve our understanding of the relationship between various health endpoints and different lag periods (e.g., <1 day, single day, multi-day distributed lags)?
- What data are available to improve our understanding of spatial and/or temporal heterogeneity of PM exposures considering different size fractions and/or components?
- At what levels of PM exposure do health effects of concern occur? Is there evidence for the occurrence of adverse health effects at levels of PM lower than those observed previously? If so, at what levels and what are the important uncertainties associated with that evidence? What is the nature of the dose-response relationships of PM for the various health effects evaluated?
- What evidence is available linking particle number concentration with adverse health effects of UF particles?
- Do risk/exposure estimates suggest that exposures of concern for PM-induced health effects will occur with current ambient levels of PM or with levels that just meet the current standards? If so, are these risks/exposures of sufficient magnitude such that the health effects might reasonably be judged to be important from a public health perspective? What are the important uncertainties associated with these risk/exposure estimates?
- To what extent is key evidence becoming available that could inform our understanding of subpopulations that are particularly sensitive or vulnerable to PM exposures? In the last review, sensitive or vulnerable subpopulations that appeared to be at greater risk for
- PM-related effects included individuals with pre-existing heart and lung diseases, older adults, and children. Has new evidence become available to suggest additional sensitive subpopulations should be given increased focus in this review (e.g., fetuses, neonates, genetically susceptible subpopulations)?
- To what extent is key evidence becoming available to inform our understanding of populations that are particularly vulnerable to PM exposures? Specifically, is there new or emerging evidence to inform our understanding of geographical, spatial, SES, and environmental justice considerations?
- To what extent have important uncertainties identified in the last review been reduced and/or have new uncertainties emerged?
- To what extent is new information available to inform our understanding of non-PM- exposure factors that might influence the associations between PM levels and health effects being considered (e.g., weather-related factors; behavioral factors such as heating/air conditioning use; driving patterns; and time-activity patterns)?
The Integrated Review Plan for the National Ambient Air Quality Standards for Particulate Matter identifies a series of policy-relevant questions that provide a framework for this assessment of the scientific evidence (U.S. EPA, 2008, 157072). These questions frame the entire review of the NAAQS for PM, and thus are informed by both science and policy considerations. The ISA organizes and presents the scientific evidence such that, when considered along with findings from risk analyses and policy considerations, will help the EPA address these questions during the NAAQS review for PM. In evaluating
In evaluating evidence on welfare effects of PM, the focus will be on evidence that can help inform these questions from the Integrated Review Plan:
- What new evidence is available on the relationship between PM mass/size fraction and/or specific PM components and visibility impairment and climate-related and other welfare effects?
- To what extent has key scientific evidence now become available to improve our understanding of the nature and magnitude of visibility, climate, and ecosystem responses to PM and the variability associated with those responses (including ecosystem type, climatic conditions, environmental effects and interactions with other environmental factors and pollutants)?
- Do the evidence, the air quality assessment, and the risk/exposure assessment provide support for considering alternative averaging times?
- At what levels of ambient PM do visibility impairment and/or environmental effects of concern occur? Is there evidence for the occurrence of adverse visibility and other welfare-related effects at levels of PM lower than those observed previously? If so, at what levels and what are the important uncertainties associated with the evidence?
- Do the analyses suggest that PM-induced visibility impairment and/or other welfare- effects will occur with current ambient levels of PM or with levels that just meet the current standards? If so, are these effects of sufficient magnitude and/or frequency such that these effects might reasonably be judged to be important from a public welfare perspective? What are the uncertainties associated with these estimates?
- What new evidence and/or techniques are available to quantify the benefits of improved visibility and/or other welfare-related effects?
- To what extent have important uncertainties identified in the last review been reduced and/or have new uncertainties emerged?
Included below is all of the second chapter of Integrated Science Assessment for Particulate Matter - even if you aren't up to reading through the entire report, skimming through just this overview may change your life forever... I've put some key points in bold:
Integrated Science Assessment for Particulate Matter (Final Report)
Notice
EPA is announcing the availability of the final Integrated Science Assessment for Particulate Matter as described in the December 15, 2009 Federal Register Notice.
EPA has released the final Integrated Science Assessment (ISA) for Particulate Matter (PM). This is EPA’s latest evaluation of the scientific literature on the potential human health and welfare effects associated with ambient exposures to particulate matter (PM). The development of this document is part of the Agency's periodic review of the national ambient air quality standards (NAAQS) for PM. The recently completed PM ISA and supplementary annexes, in conjunction with additional technical and policy assessments developed by EPA’s Office of Air and Radiation, will provide the scientific basis to inform EPA decisions related to the review of the current PM NAAQS.
 PM is one of six principal (or criteria) pollutants for which EPA has established NAAQS. Periodically, EPA reviews the scientific basis for these standards by preparing an ISA (formerly called an Air Quality Criteria Document). The ISA and supplementary annexes, in conjunction with additional technical and policy assessments, provide the scientific basis for EPA decisions on the adequacy of the current NAAQS and the appropriateness of possible alternative standards. The Clean Air Scientific Advisory Committee (CASAC), an independent science advisory committee whose existence and whose review and advisory functions are mandated by Section 109 (d) (2) of the Clean Air Act, is charged (among other things) with independent scientific review of EPA's air quality criteria.
The first and second drafts of the PM ISA were released on December 22, 2008 and July 31, 2009, respectively, for independent external peer review and public comment. These drafts were reviewed at public meetings of the CASAC PM Review Panel on April 1-2, 2009 and October 5-6, 2009, respectively. This final PM ISA has benefited from the expert comments received at the CASAC meetings and from public comments, and it has been revised accordingly.
Next Steps
This is the final document. Additional technical and policy assessment documents for this review are available from the Office of Air Quality Planning and Standards ( http://www.epa.gov/ttn/naaqs/standards/pm/s_pm_index.html).
Contact
- stanek [dot] lindsay [at] epa [dot] gov
- by phone at: 919-541-7792
- by fax at: 919-541-2985
- by email at: stanek [dot] lindsay [at] epa [dot] gov
Background
Chapter 2. Integrative Health and Welfare Effects Overview
The subsequent chapters of this ISA will present the most policy-relevant information related to this review of the NAAQS for PM. This chapter integrates the key findings from the disciplines evaluated in this current assessment of the PM scientific literature, which includes the atmospheric sciences, ambient air data analyses, exposure assessment, dosimetry, health studies (e.g., toxicological, controlled human exposure, and epidemiologic), and welfare effects. The EPA framework for causal determinations described in Chapter 1 has been applied to the body of scientific evidence in order to collectively examine the health or welfare effects attributed to PM exposure in a two-step process.
As described in Chapter 1, EPA assesses the results of recent relevant publications, building upon evidence available during the previous NAAQS reviews, to draw conclusions on the causal relationships between relevant pollutant exposures and health or environmental effects. This ISA uses a five-level hierarchy that classifies the weight of evidence for causation:
- Causal relationship
- Likely to be a causal relationship
- Suggestive of a causal relationship
- Inadequate to infer a causal relationship
- Not likely to be a causal relationship
Beyond judgments regarding causality are questions relevant to quantifying health or environmental risks based on our understanding of the quantitative relationships between pollutant exposures and health or welfare effects. Once a determination is made regarding the causal relationship between the pollutant and outcome category, important questions regarding quantitative relationships include:
What is the concentration-response or dose-response relationship?
Under what exposure conditions (amount deposited, dose or concentration, duration and pattern) are effects observed?
What populations appear to be differentially affected (i.e., more susceptible) to effects?
What elements of the ecosystem (e.g., types, regions, taxonomic groups, populations, functions, etc.) appear to be affected, or are more sensitive to effects?
To address these questions, in the second step of the EPA framework, the entirety of quantitative evidence is evaluated to identify and characterize potential concentration-response relationships. This requires evaluation of levels of pollutant and exposure durations at which effects were observed for exposed populations including potentially susceptible populations.
This chapter summarizes and integrates the newly available scientific evidence that best informs consideration of the policy-relevant questions that frame this assessment, presented in Chapter 1. Section 2.1 discusses the trends in ambient concentrations and sources of PM and provides a brief summary of ambient air quality. Section 2.2 presents the evidence regarding personal exposure to ambient PM in outdoor and indoor microenvironments, and it discusses the relationship between ambient PM concentrations and exposure to PM from ambient sources. Section 2.3 integrates the evidence for studies that examine the health effects associated with short-and long-term exposure to PM and discusses important uncertainties identified in the interpretation of the scientific evidence. Section 2.4 provides a discussion of policy-relevant considerations, such as potentially susceptible populations, lag structure, and the PM concentration-response relationship, and PM sources and constituents linked to health effects. Section 2.5 summarizes the evidence for welfare effects related to PM exposure. Finally, Section 2.6 provides all of the causal determinations reached for each of the health outcomes and PM exposure durations evaluated in this ISA.
2.1. Concentrations and Sources of Atmospheric PM
2.1.1. Ambient PM Variability and Correlations
Recently, advances in understanding the spatiotemporal distribution of PM mass and its
constituents have been made, particularly with regard to PM 2.5 and its components as well as
ultrafine particles (UFPs). Emphasis in this ISA is placed on the period from 2005-2007,
incorporating the most recent validated EPA Air Quality System (AQS) data. The AQS is EPA’s
repository for ambient monitoring data reported by the national, and state and local air monitoring
networks. Measurements of PM 2.5 and PM 10 are reported into AQS, while PM 10-2.5 concentrations
are obtained as the difference between PM 10 and PM 2.5 (after converting PM 10 concentrations from
STP to local conditions; Section 3.5). Note, however, that a majority of U.S. counties were not
represented in AQS because their population fell below the regulatory monitoring threshold.
Moreover, monitors reporting to AQS were not uniformly distributed across the U.S. or within
counties, and conclusions drawn from AQS data may not apply equally to all parts of a geographic
region. Furthermore, biases can exist for some PM constituents (and hence total mass) owing to
volatilization losses of nitrates and other semi-volatile compounds, and, conversely, to retention of
particle-bound water by hygroscopic species. The degree of spatial variability in PM was likely to be
region-specific and strongly influenced by local sources and meteorological and topographic
conditions.
2.1.1.1. Spatial Variability across the U.S.
AQS data for daily average concentrations of PM 2.5 for 2005-2007 showed considerable
variability across the U.S. (Section 3.5.1.1). Counties with the highest average concentrations of
PM 2.5 (>18 μg/m3) were reported for several counties in the San Joaquin Valley and inland southern
California as well as Jefferson County, AL (containing Birmingham) and Allegheny County, PA
(containing Pittsburgh). Relatively few regulatory monitoring sites have the appropriate co-located
monitors for computing PM 10-2.5 , resulting in poor geographic coverage on a national scale
(Figure 3-10). Although the general understanding of PM differential settling leads to an expectation
of greater spatial heterogeneity in the PM 10-2.5 fraction, deposition of particles as a function of size
depends strongly on local meteorological conditions. Better geographic coverage is available for
PM 10 , where the highest reported annual average concentrations (>50 μg/m3) occurred in southern
California, southern Arizona and central New Mexico. The size distribution of PM varied
substantially by location, with a generally larger fraction of PM 10 mass in the PM 10-2.5 size range in
western cities (e.g., Phoenix and Denver) and a larger fraction of PM 10 in the PM 2.5 size range in
eastern U.S. cities (e.g., Pittsburgh and Philadelphia). UFPs are not measured as part of AQS or any
other routine regulatory network in the U.S. Therefore, limited information is available regarding
regional variability in the spatiotemporal distribution of UFPs.
Spatial variability in PM 2.5 components obtained from the Chemical Speciation Network
(CSN) varied considerably by species from 2005-2007 (Figures 3-12 through 3-18). The highest
annual average organic carbon (OC) concentrations were observed in the western and southeastern
U.S. OC concentrations in the western U.S. peaked in the fall and winter, while OC concentrations in
the Southeast peaked anytime between spring and fall. Elemental carbon (EC) exhibited less
seasonality than OC and showed lowest seasonal variability in the eastern half of the U.S. The
December 2009 highest annual average EC concentrations were present in Los Angeles, Pittsburgh, New York, and
El Paso. Concentrations of sulfate (SO 4 2–) were higher in the eastern U.S. as a result of higher SO 2
emissions in the East compared with the West. There is also considerable seasonal variability with
higher SO 4 2– concentrations in the summer months when the oxidation of SO 2 proceeds at a faster
rate than during the winter. Nitrate (NO 3 –) concentrations were highest in California and during the
winter in the Upper Midwest. In general, NO 3 – was higher in the winter across the country, in part as
a result of temperature-driven partitioning and volatilization. Exceptions existed in Los Angeles and
Riverside, CA, where high NO 3 – concentrations appeared year-round. There is variation in both
PM 2.5 mass and composition among cities, some of which might be due to regional differences in
meteorology, sources, and topography.
2.1.1.2. Spatial Variability on the Urban and Neighborhood Scales
In general, PM 2.5 has a longer atmospheric lifetime than PM 10-2.5 . As a result, PM 2.5 is more
homogeneously distributed than PM 10-2.5 , whose concentrations more closely reflect proximity to
local sources (Section 3.5.1.2). Because PM 10 encompasses PM 10-2.5 in addition to PM 2.5 , it also
exhibits more spatial heterogeneity than PM 2.5 . Urban- and neighborhood-scale variability in PM
mass and composition was examined by focusing on 15 metropolitan areas, which were chosen
based on their geographic distribution and coverage in recent health effects studies. The urban areas
selected were Atlanta, Birmingham, Boston, Chicago, Denver, Detroit, Houston, Los Angeles, New
York, Philadelphia, Phoenix, Pittsburgh, Riverside, Seattle and St. Louis. Inter-monitor correlation
remained higher over long distances for PM 2.5 as compared with PM 10 in these 15 urban areas. To a
large extent, greater variation in PM 2.5 and PM 10 concentrations within cities was observed in areas
with lower ratios of PM 2.5 to PM 10 . When the data was limited to only sampler pairs with less than
4 km separation (i.e., on a neighborhood scale), inter-sampler correlations remained higher for PM 2.5
than for PM 10 . The average inter-sampler correlation was 0.93 for PM 2.5 , while it dropped to 0.70 for
PM 10 (Section 3.5.1.3). Insufficient data were available in the 15 metropolitan areas to perform
similar analyses for PM 10-2.5 using co-located, low volume FRM monitors.
As previously mentioned, UFPs are not measured as part of AQS or any other routine
regulatory network in the U.S. Therefore, information about the spatial variability of UFPs is sparse;
however, their number concentrations are expected to be highly spatially and temporally variable.
This has been shown on the urban scale in studies in which UFP number concentrations drop off
quickly with distance from roads compared to accumulation mode particle numbers.
2.1.2. Trends and Temporal Variability
Overall, PM 2.5 concentrations decreased from 1999 (the beginning of nationwide monitoring
for PM 2.5 ) to 2007 in all ten EPA Regions, with the 3-yr avg of the 98th percentile of 24-h PM 2.5
concentrations dropping 10% over this time period. However from 2002-2007, concentrations of
PM 2.5 were nearly constant with decreases observed in only some EPA Regions (Section 3.5.2.1).
Concentrations of PM 2.5 components were only available for 2002-2007 using CSN data and showed
little decline over this time period. This trend in PM 2.5 components is consistent with trends in PM 2.5
mass concentration observed after 2002 (shown in Figures 3-44 through 3-47). Concentrations of
PM 10 also declined from 1988 to 2007 in all ten EPA Regions.
Using hourly PM observations in the 15 metropolitan areas, diel variation showed average
hourly peaks that differ by size fraction and region (Section 3.5.2.3). For both PM 2.5 and PM 10 , a
morning peak was typically observed starting at approximately 6:00 a.m., corresponding with the
start of morning rush hour. There was also an evening concentration peak that was broader than the
morning peak and extended into the overnight period, reflecting the concentration increase caused by
the usual collapse of the mixing layer after sundown. The magnitude and duration of these peaks
varied considerably by metropolitan area investigated.
UFPs were found to exhibit similar two-peaked diel patterns in Los Angeles and the San
Joaquin Valley of CA and Rochester, NY as well as in Kawasaki City, Japan, and Copenhagen,
Denmark. The morning peak in UFPs likely represents primary source emissions, such as rush-hour
traffic, while the afternoon peak likely represents the combination of primary source emissions and
nucleation of new particles.
2.1.3. Correlations between Copollutants
Correlations between PM and gaseous copollutants, including SO 2 , NO 2 , carbon monoxide
(CO) and O 3 , varied both seasonally and spatially between and within metropolitan areas
(Section 3.5.3). On average, PM 2.5 and PM 10 were correlated with each other better than with the
gaseous copollutants. Although data are limited for PM 10-2.5 , the available data suggest a stronger
correlation between PM 10 and PM 10-2.5 than between PM 2.5 and PM 10-2.5 on a national basis.There
was relatively little seasonal variability in the mean correlation between PM in both size fractions
and SO 2 and NO 2 . CO, however, showed higher correlations with PM 2.5 and PM 10 on average in the
winter compared with the other seasons. This seasonality results in part because a larger fraction of
PM is primary in origin during the winter. To the extent that this primary component of PM is
associated with common combustion sources of NO 2 and CO, then higher correlations with these
gaseous copollutants are to be expected. Increased atmospheric stability in colder months also results
in higher correlations between primary pollutants (Section 3.5).
The correlation between daily maximum 8-h avg O 3 and 24-h avg PM 2.5 showed the highest
degree of seasonal variability with positive correlations on average in summer (avg = 0.56) and
negative correlations on average in the winter (avg = -0.30). During the transition seasons, spring
and fall, correlations were mixed but on average were still positive. PM 2.5 is both primary and
secondary in origin, whereas O 3 is only secondary. Photochemical production of O 3 and secondary
PM in the planetary boundary layer (PBL) is much slower during the winter than during other
seasons. Primary pollutant concentrations (e.g., primary PM 2.5 components, NO and NO 2 ) in many
urban areas are elevated in winter as the result of heating emissions, cold starts and low mixing
heights. O 3 in the PBL during winter is mainly associated with air subsiding from above the
boundary layer following the passage of cold fronts, and this subsiding air has much lower PM
concentrations than are present in the PBL. Therefore, a negative association between O 3 and PM 2.5
is frequently observed in the winter. During summer, both O 3 and secondary PM 2.5 are produced in
the PBL and in the lower free troposphere at faster rates compared to winter, and so they tend to be
positively correlated.
2.1.4. Measurement Techniques
The federal reference methods (FRMs) for PM 2.5 and PM 10 are based on criteria outlined in
the Code of Federal Regulations. They are, however, subject to several limitations that should be
kept in mind when using compliance monitoring data for health studies. For example, FRM
techniques are subject to the loss of semi-volatile species such as organic compounds and
ammonium nitrate (especially in the West). Since FRMs based on gravimetry use 24-h integrated
filter samples to collect PM mass, no information is available for variations over shorter averaging
times from these instruments. However, methods have been developed to measure real-time PM
mass concentrations. Real-time (or continuous and semi-continuous) measurement techniques are
also available for PM species, such as particle into liquid sampler (PILS) for multiple ions analysis
and aerosol mass spectrometer (AMS) for multiple components analysis (Section 3.4.1). Advances
have also been achieved in PM organic speciation. New 24-h FRMs and Federal Equivalent Methods
(FEMs) based on gravimetry and continuous FEMs for PM 10-2.5 are available. FRMs for PM 10-2.5 rely
on calculating the difference between co-located PM 10 and PM 2.5 measurements while a
dichotomous sampler is designated as an FEM.
2.1.5. PM Formation in the Atmosphere and Removal
PM in the atmosphere contains both primary (i.e., emitted directly by sources) and secondary
components, which can be anthropogenic or natural in origin. Secondary PM components can be
produced by the oxidation of precursor gases such as SO 2 and NO X to acids followed by
neutralization with ammonia (NH 3 ) and the partial oxidation of organic compounds. In addition to
being emitted as primary particles, UFPs are produced by the nucleation of H 2 SO 4 vapor, H 2 O
vapor, and perhaps NH 3 and certain organic compounds. Over most of the earth’s surface, nucleation
is probably the major mechanism forming new UFPs. New UFP formation has been observed in
environments ranging from relatively unpolluted marine and continental environments to polluted
urban areas as an ongoing background process and during nucleation events. However, as noted
above, a large percentage of UFPs come from combustion-related sources such as motor vehicles.
Developments in the chemistry of formation of secondary organic aerosol (SOA) indicate that
oligomers are likely a major component of OC in aerosol samples. Recent observations also suggest
that small but significant quantities of SOA are formed from the oxidation of isoprene in addition to
the oxidation of terpenes and organic hydrocarbons with six or more carbon atoms. Gasoline engines
have been found to emit a mix of nucleation-mode heavy and large polycyclic aromatic
hydrocarbons on which unspent fuel and trace metals can condense, while diesel particles are
composed of a soot nucleus on which sulfates and hydrocarbons can condense. To the extent that the
primary component of organic aerosol is overestimated in emissions from combustion sources, the
semi-volatile components are underestimated. This situation results from the lack of capture of
evaporated semi-volatile components upon dilution in common emissions tests. As a result, near-
traffic sources of precursors to SOA would be underestimated. The oxidation of these precursors
results in more oxidized forms of SOA than previously considered, in both near source urban
environments and further downwind. Primary organic aerosol can also be further oxidized to forms
that have many characteristics in common with oxidized SOA formed from gaseous precursors.
Organic peroxides constitute a significant fraction of SOA and represent an important class of
reactive oxygen species (ROS) that have high oxidizing potential. More information on sources,
emissions and deposition of PM are included in Section 3.3.
Wet and dry deposition are important processes for removing PM and other pollutants from the
atmosphere on urban, regional, and global scales. Wet deposition includes incorporation of particles
into cloud droplets that fall as rain (rainout) and collisions with falling rain (washout). Other
hydrometeors (snow, ice) can also serve the same purpose. Dry deposition involves transfer of
particles through gravitational settling and/or by impaction on surfaces by turbulent motions. The
effects of deposition of PM on ecosystems and materials are discussed in Section 2.5 and in
Chapter 9.
2.1.6. Source Contributions to PM
Results of receptor modeling calculations indicate that PM 2.5 is produced mainly by
combustion of fossil fuel, either by stationary sources or by transportation. A relatively small number
of broadly defined source categories, compared to the total number of chemical species that typically
are measured in ambient monitoring source receptor studies, account for the majority of the observed
PM mass. Some ambiguity is inherent in identifying source categories. For example, quite different
mobile sources such as trucks, farm equipment, and locomotives rely on diesel engines and ancillary
data is often required to resolve these sources. A compilation of study results shows that secondary
SO 4 2– (derived mainly from SO 2 emitted by Electricity Generating Units [EGUs]), NO 3 – (from the
oxidation of NO x emitted mainly from transportation sources and EGUs), and primary mobile source
categories, constitute most of PM 2.5 (and PM 10 ) in the East. PM 10-2.5 is mainly primary in origin,
having been emitted as fully formed particles derived from abrasion and crushing processes, soil
disturbances, plant and insect fragments, pollens and other microorganisms, desiccation of marine
aerosol emitted from bursting bubbles, and hygroscopic fine PM expanding with humidity to coarse
mode. Gases such as HNO 3 can also condense directly onto preexisting coarse particles. Suspended
primary coarse PM can contain Fe, Si, Al, and base cations from soil, plant and insect fragments,
pollen, fungal spores, bacteria, and viruses, as well as fly ash, brake lining particles, debris, and
automobile tire fragments. Quoted uncertainties in the source apportionment of constituents in
ambient aerosol samples typically range from 10 to 50%. An intercomparison of source
apportionment techniques indicated that the same major source categories of PM 2.5 were consistently
identified by several independent groups working with the same data sets. Soil-, sulfate-, residual
oil-, and salt-associated mass were most clearly identified by the groups. Other sources with more
ambiguous signatures, such as vegetative burning and traffic-related emissions were less consistently
identified.
Spatial variability in source contributions across urban areas is an important consideration in
assessing the likelihood of exposure error in epidemiologic studies relating health outcomes to
sources. Concepts similar to those for using ambient concentrations as surrogates for personal
exposures apply here. Some source attribution studies for PM 2.5 indicate that intra-urban variability
increases in the following order: regional sources (e.g., secondary SO 4 2– originating from EGUs)
< area sources (e.g., on-road mobile sources) < point sources (e.g., metals from stacks of smelters).
Although limited information was available for PM 10-2.5 , it does indicate a similar ordering, but
without a regional component (resulting from the short lifetime of PM 10-2.5 compared to transport
times on the regional scale). More discussion on source contributions to PM is available in
Section 3.6.
2.1.7. Policy-Relevant Background
The background concentrations of PM that are useful for risk and policy assessments, which
inform decisions about the NAAQS are referred to as policy-relevant background (PRB)
concentrations. PRB concentrations have historically been defined by EPA as those concentrations
that would occur in the U.S. in the absence of anthropogenic emissions in continental North America
defined here as the U.S., Canada, and Mexico. For this document, PRB concentrations include
contributions from natural sources everywhere in the world and from anthropogenic sources outside
continental North America. Background concentrations so defined facilitated separation of pollution
that can be controlled by U.S. regulations or through international agreements with neighboring
countries from those that were judged to be generally uncontrollable by the U.S. Over time,
consideration of potential broader ranging international agreements may lead to alternative
determinations of which PM source contributions should be considered by EPA as part of PRB.
Contributions to PRB concentrations of PM include both primary and secondary natural and
anthropogenic components. For this document, PRB concentrations of PM 2.5 for the continental U.S.
were estimated using EPA’s Community Multi-scale Air Quality (CMAQ) modeling system, a
deterministic, chemical-transport model (CTM), using output from GEOS-Chem a global-scale
model for CMAQ boundary conditions. PRB concentrations of PM 2.5 were estimated to be less than
1 μg/m3 on an annual basis, with maximum daily average values in a range from 3.1 to 20 μg/m3 and
having a peak of 63 μg/m3 at the nine national park sites across the U.S. used to evaluate model
performance for this analysis. A description of the models and evaluation of their performance is
given in Section 3.6 and further details about the calculations of PRB concentrations are given in
Section 3.7.
2.2. Human Exposure
This section summarizes the findings from the recent exposure assessment literature. This
summary is intended to support the interpretation of the findings from epidemiologic studies and
reflects the material presented in Section 3.8. Attention is given to how concentration metrics can be
used in exposure assessment and what errors and uncertainties are incurred for different approaches.
Understanding of exposure errors is important because exposure error can potentially bias an
estimate of a health effect or increase the size of confidence intervals around a health effect estimate.
2.2.1. Spatial Scales of PM Exposure Assessment
Assessing population-level exposure at the urban scale is particularly relevant for time-series
epidemiologic studies, which provide information on the relationship between health effects and
community-average exposure, rather than an individual’s exposure. PM concentrations measured at a
central-site ambient monitor are used as surrogates for personal PM exposure. However, the
correlation between the PM concentration measured at central-site ambient monitor(s) and the
unknown true community average concentration depends on the spatial distribution of PM, the
location of the monitoring site(s) chosen to represent the community average, and division of the
community by terrain features or local sources into several sub-communities that differ in the
temporal pattern of pollution. Concentrations of SO 4 2– and some components of SOA measured at
central-site monitors are expected to be uniform in urban areas because of the regional nature of their
sources. However, this is not true for primary components like EC whose sources are strongly
spatially variable in urban areas.
At micro-to-neighborhood scales, heterogeneity of sources and topography contribute to
variability in exposure. This is particularly true for PM 10-2.5 and for UFPs, which have spatially
variable urban sources and loss processes (mainly gravitational settling for PM 10-2.5 and coagulation
for UFPs) that also limit their transport from sources more readily than for PM 2.5 . Personal activity
patterns also vary across urban areas and across regions. Some studies, conducted mainly in Europe,
have found personal PM 2.5 and PM 10 exposures for pedestrians in street canyons to be higher than
ambient concentrations measured by urban central site ambient monitors. Likewise,
microenvironmental UFP concentrations were observed to be substantially higher in near-road
environments, street canyons, and tunnels when compared with urban background concentrations.
In-vehicle UFP and PM 2.5 exposures can also be important. As a result, concentrations measured by
ambient monitors likely do not reflect the contributions of UFP or PM 2.5 exposures to individuals
while commuting.
There is significant variability within and across regions of the country with respect to indoor
exposures to ambient PM. Infiltrated ambient PM concentrations depend in part on the ventilation
properties of the building or vehicle in which the person is exposed. PM infiltration factors depend
on particle size, chemical composition, season, and region of the country. Infiltration can best be
modeled dynamically rather than being represented by a single value. Season is important to PM
infiltration because it affects the ventilation practices (e.g., open windows) used. In addition, ambient
temperature and humidity conditions affect the transport, dispersion, and size distribution of PM.
Residential air exchange rates have been observed to be higher in the summer for regions with low
air conditioning usage. Regional differences in air exchange rates (Southwest < Southeast
< Northeast < Northwest) also reflect ventilation practices. Differential infiltration occurs as a
function of PM size and composition (the latter of which is described below). PM infiltration is
larger for accumulation mode particles than for UFPs and PM 10-2.5 . Differential infiltration by size
fraction can affect exposure estimates if not accurately characterized.
2.2.2. Exposure to PM Components and Copollutants
Emission inventories and source apportionment studies suggest that sources of PM exposure
vary by region. Comparison of studies performed in the eastern U.S. with studies performed in the
western U.S. suggest that the contribution of SO 4 2– to exposure is higher for the East (16-46%)
compared with the West (~4%) and that motor vehicle emissions and secondary NO 3 – are larger
sources of exposure for the West (~9%) as compared with the East (~4%). Results of source
apportionment studies of exposure to SO 4 2– indicate that SO 4 2– exposures are mainly attributable to
ambient sources. Source apportionment for OC and EC is difficult because they originate from both
indoor and outdoor sources. Exposure to OC of indoor and outdoor origin can be distinguished by
the presence of aliphatic C-H groups generated indoors, since outdoor concentrations of aliphatic
C-H are low. Studies of personal exposure to ambient trace metal have shown significant variation
among cities and over seasons. This is in response to geographic and seasonal variability in sources
including incinerator operation, fossil fuel combustion, biomass combustion (wildfires), and the
resuspension of crustal materials in the built environment. Differential infiltration is also affected by
variations in particle composition and volatility. For example, EC infiltrates more readily than OC.
This can lead to outdoor-indoor differentials in PM composition.
Some studies have explored the relationship between PM and copollutant gases and suggested
that certain gases can serve as surrogates for describing exposure to other air pollutants. The findings
indicate that ambient concentrations of gaseous copollutants can act as surrogates for personal
exposure to ambient PM. Several studies have concluded that ambient concentrations of O 3 , NO 2 ,
and SO 2 are associated with the ambient component of personal exposure to total PM 2.5 . If
associations between ambient gases and personal exposure to PM 2.5 of ambient origin exist, such
associations are complex and vary by season and location.
2.2.3. Implications for Epidemiologic Studies
In epidemiologic studies, exposure may be estimated using various approaches, most of which
rely on measurements obtained using central site monitors. The magnitude and direction of the
biases introduced through error in exposure measurement depend on the extent to which the error is
associated with the measured PM concentration. In general, when exposure error is not strongly
correlated with the measured PM concentration, bias is toward the null and effect estimates are
underestimated. Moreover, lack of information regarding exposure measurement error can also add
uncertainty to the health effects estimate.
One important factor to be considered is the spatial variation in PM concentrations. The degree
of urban-scale spatial variability in PM concentrations varies across the country and by size fraction.
PM 2.5 concentrations are relatively well-correlated across monitors in the urban areas examined for
this assessment. The limited available evidence indicates that there is greater spatial variability in
PM 10-2.5 concentrations than PM 2.5 concentrations, resulting in increased exposure error for the larger
size fraction. Likewise, studies have shown UFPs to be more spatially variable across urban areas
compared to PM 2.5 . Even if PM 2.5 , PM 10-2.5 , or UFP concentrations measured at sites within an urban
area are generally highly correlated, significant spatial variation in their concentrations can occur on
any given day. In addition, there can be differential exposure errors for PM components (e.g., SO 4 2–,
OC, EC). Current information suggests that UFPs, PM 10-2.5, and some PM components are more
spatially variable than PM 2.5 . Spatial variability of these PM indicators adds uncertainty to exposure
estimates.
Overall, recent studies generally confirm and build upon the key conclusions of the 2004 PM
AQCD: separation of total PM exposures into ambient and nonambient components reduces
potential uncertainties in the analysis and interpretation of PM health effects data; and ambient PM
concentration can be used as a surrogate for ambient PM exposure in community time-series
epidemiologic studies because the change in ambient PM concentration should be reflected in the
change in the health risk coefficient. The use of the community average ambient PM 2.5 concentration
as a surrogate for the community average personal exposure to ambient PM 2.5 is not expected to
change the principal conclusions from time-series and most panel epidemiologic studies that use
community average health and pollution data. Several recent studies support this by showing how
the ambient component of personal exposure to PM 2.5 could be estimated using various tracer and
source apportionment techniques and by showing that the ambient component is highly correlated
with ambient concentrations of PM 2.5 . These studies show that the non-ambient component of
personal exposure to PM 2.5 is largely uncorrelated with ambient PM 2.5 concentrations. A few panel
epidemiologic studies have included personal as well as ambient monitoring data, and generally
reported associations with all types of PM measurements. Epidemiologic studies of long-term
exposure typically exploit the differences in PM concentration across space, as well as time, to
estimate the effect of PM on the health outcome of interest. Long-term exposure estimates are most
accurate for pollutants that do not vary substantially within the geographic area studied.
2.3. Health Effects
This section evaluates the evidence from toxicological, controlled human exposure, and
epidemiologic studies that examined the health effects associated with short- and long-term exposure
to PM (i.e., PM 2.5 , PM 10-2.5 and UFPs). The results from the health studies evaluated in combination
with the evidence from atmospheric chemistry and exposure assessment studies contribute to the
causal determinations made for the health outcomes discussed in this assessment (a description of
the causal framework can be found in Section 1.5.4). In the following sections a discussion of the
causal determinations will be presented by PM size fraction and exposure duration (i.e., short- or
long-term exposure) for the health effects for which sufficient evidence was available to conclude a
causal, likely to be causal or suggestive relationship. Although not presented in depth in this chapter,
a detailed discussion of the underlying evidence used to formulate each causal determination can be
found in Chapters 6 and 7.
Cardiovascular Effects
Epidemiologic studies that examined the effect of PM 2.5 on cardiovascular emergency
department (ED) visits and hospital admissions reported consistent positive associations
(predominantly for ischemic heart disease [IHD] and congestive heart failure [CHF]), with the
majority of studies reporting increases ranging from 0.5 to 3.4% per 10 μg/m3 increase in PM 2.5 .
These effects were observed in study locations with mean 1 24-h avg PM 2.5 concentrations ranging
from 7-18 μg/m3 (Section 6.2.10). The largest U.S.-based multicity study evaluated, Medicare Air
Pollution Study (MCAPS), provided evidence of regional heterogeneity (e.g., the largest excess risks
occurred in the Northeast [1.08%]) and seasonal variation (e.g., the largest excess risks occurred
during the winter season [1.49%]) in PM 2.5 cardiovascular disease (CVD) risk estimates, which is
consistent with the null findings of several single-city studies conducted in the western U.S. These
associations are supported by multicity epidemiologic studies that observed consistent positive
associations between short-term exposure to PM 2.5 and cardiovascular mortality and also reported
regional and seasonal variability in risk estimates. The multicity studies evaluated reported
consistent increases in cardiovascular mortality ranging from 0.47 to 0.85% in study locations with
mean 24-h avg PM 2.5 concentrations above 12.8 μg/m3 (Table 6-15).
Controlled human exposure studies have demonstrated PM 2.5 -induced changes in various
measures of cardiovascular function among healthy and health-compromised adults. The most
consistent evidence is for altered vasomotor function following exposure to diesel exhaust (DE) or
CAPs with O 3 (Section 6.2.4.2). Although these findings provide biological plausibility for the
observations from epidemiologic studies, the fresh DE used in the controlled human exposure
studies evaluated contains gaseous components (e.g., CO, NO x ), and therefore, the possibility that
some of the changes in vasomotor function might be due to gaseous components cannot be ruled out.
Furthermore, the prevalence of UFPs in fresh DE limits the ability to conclusively attribute the
observed effects to either the UF fraction or PM 2.5 as a whole. An evaluation of toxicological studies
found evidence for altered vessel tone and microvascular reactivity, which provide coherence and
biological plausibility for the vasomotor effects that have been observed in both the controlled
human exposure and epidemiologic studies (Section 6.2.4.3). However, most of these toxicological
studies exposed animals via intratracheal (IT) instillation or using relatively high inhalation
concentrations.
In addition to the effects observed on vasomotor function, myocardial ischemia has been
observed across disciplines through PM 2.5 effects on ST-segment depression, with toxicological
studies providing biological plausibility by demonstrating reduced blood flow during ischemia
(Section 6.2.3). There is also a growing body of evidence from controlled human exposure and
toxicological studies demonstrating PM 2.5 -induced changes on heart rate variability (HRV) and
markers of systemic oxidative stress (Sections 6.2.1 and 6.2.9, respectively). Additional but
inconsistent effects of PM 2.5 on blood pressure (BP), blood coagulation markers, and markers of
systemic inflammation have also been reported across disciplines. Toxicological studies have
provided biologically plausible mechanisms (e.g., increased right ventricular pressure and
diminished cardiac contractility) for the associations observed between PM 2.5 and CHF in
epidemiologic studies.
Together, the collective evidence from epidemiologic, controlled human exposure, and
toxicological studies is sufficient to conclude that a causal relationship exists between short-
term exposures to PM 2.5 and cardiovascular effects.
Respiratory Effects
The recent epidemiologic studies evaluated report consistent positive associations between
short-term exposure to PM 2.5 and respiratory ED visits and hospital admissions for chronic
obstructive pulmonary disease (COPD) and respiratory infections (Section 6.3). Positive associations
were also observed for asthma ED visits and hospital admissions for adults and children combined,
but effect estimates are imprecise and not consistently positive for children alone. Most studies
reported effects in the range of ~1% to 4% increase in respiratory hospital admissions and ED visits
and were observed in study locations with mean 24-h avg PM 2.5 concentrations ranging from
6.1-22 μg/m3. Additionally, multicity epidemiologic studies reported consistent positive associations
between short-term exposure to PM 2.5 and respiratory mortality as well as regional and seasonal
variability in risk estimates. The multicity studies evaluated reported consistent, precise increases in
respiratory mortality ranging from 1.67 to 2.20% in study locations with mean 24-h avg PM 2.5
concentrations above 12.8 μg/m3 (Table 6-15). Evidence for PM 2.5 -related respiratory effects was
also observed in panel studies, which indicate associations with respiratory symptoms, pulmonary
function, and pulmonary inflammation among asthmatic children. Although not consistently
observed, some controlled human exposure studies have reported small decrements in various
measures of pulmonary function following controlled exposures to PM 2.5 (Section 6.3.2.2).
Controlled human exposure studies using adult volunteers have demonstrated increased
markers of pulmonary inflammation following exposure to a variety of different particle types;
oxidative responses to DE and wood smoke; and exacerbations of allergic responses and allergic
sensitization following exposure to DE particles (Section 6.3). Toxicological studies have provided
additional support for PM 2.5 -related respiratory effects through inhalation exposures of animals to
CAPs, DE, other traffic-related PM and wood smoke. These studies reported an array of respiratory
effects including altered pulmonary function, mild pulmonary inflammation and injury, oxidative
responses, airway hyperresponsiveness (AHR) in allergic and non-allergic animals, exacerbations of
allergic responses, and increased susceptibility to infections (Section 6.3).
Overall, the evidence for an effect of PM 2.5 on respiratory outcomes is somewhat restricted by
limited coherence between some of the findings from epidemiologic and controlled human exposure
studies for the specific health outcomes reported and the sub-populations in which those health
outcomes occur. Epidemiologic studies have reported variable results among specific respiratory
outcomes, specifically in asthmatics (e.g., increased respiratory symptoms in asthmatic children, but
not increased asthma hospital admissions and ED visits) (Section 6.3.8). Additionally, respiratory
effects have not been consistently demonstrated following controlled exposures to PM 2.5 among
asthmatics or individuals with COPD. Collectively, the epidemiologic, controlled human exposure,
and toxicological studies evaluated demonstrate a wide range of respiratory responses, and although
results are not fully consistent and coherent across studies the evidence is sufficient to conclude that
a causal relationship is likely to exist between short-term exposures to PM 2.5 and
respiratory effects.
Mortality
An evaluation of the epidemiologic literature indicates consistent positive associations
between short-term exposure to PM 2.5 and all-cause, cardiovascular-, and respiratory-related
mortality (Section 6.5.2.2.). The evaluation of multicity studies found that consistent and precise risk
estimates for all-cause (nonaccidental) mortality that ranged from 0.29 to 1.21% per 10 μg/m3
increase in PM 2.5 at lags of 1 and 0-1 days. In these study locations, mean 24-h avg PM 2.5
concentrations were 12.8 μg/m3 and above (Table 6-15). Cardiovascular-related mortality risk
estimates were found to be similar to those for all-cause mortality; whereas, the risk estimates for
respiratory-related mortality were consistently larger (i.e., 1.01-2.2%) using the same lag periods and
averaging indices. The studies evaluated that examined the relationship between short-term exposure
to PM 2.5 and cardiovascular effects (Section 6.2) provide coherence and biological plausibility for
PM 2.5 -induced cardiovascular mortality, which represents the largest component of total
(nonaccidental) mortality (~ 35%) (American Heart Association, 2009, 198920). However, as noted
in Section 6.3, there is limited coherence between some of the respiratory morbidity findings from
epidemiologic and controlled human exposure studies for the specific health outcomes reported and
the subpopultions in which those health outcomes occur, complicating the interpretation of the PM 2.5
respiratory mortality effects observed. Regional and seasonal patterns in PM 2.5 risk estimates were
observed with the greatest effect estimates occurring in the eastern U.S. and during the spring. Of the
studies evaluated only Burnett et al. (2004, 086247), a Canadian multicity study, analyzed gaseous
pollutants and found mixed results, with possible confounding of PM 2.5 risk estimates by NO 2 .
Although the recently evaluated U.S.-based multicity studies did not analyze potential confounding
of PM 2.5 risk estimates by gaseous pollutants, evidence from the limited number of single-city
studies evaluated in the 2004 PM AQCD (U.S. EPA, 2004, 056905) suggest that gaseous
copollutants do not confound the PM 2.5 -mortality association. This is further supported by studies
that examined the PM 10 -mortality relationship. An examination of effect modifiers (e.g.,
demographic and socioeconomic factors), specifically air conditioning use as an indicator for
decreased pollutant penetration indoors, has suggested that PM 2.5 risk estimates increase as the
percent of the population with access to air conditioning decreases. Collectively, the epidemiologic
literature provides evidence that a causal relationship exists between short-term exposures
to PM 2.5 and mortality.
2.3.1.2. Effects of Long-Term Exposure to PM 2.5
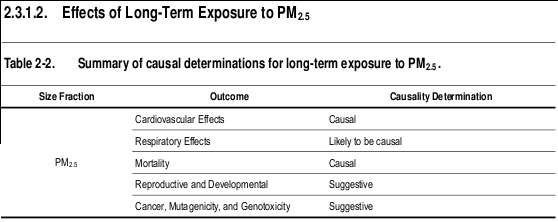
Cardiovascular Effects
The strongest evidence for cardiovascular health effects related to long-term exposure to PM 2.5
comes from large, multicity U.S.-based studies, which provide consistent evidence of an association
between long-term exposure to PM 2.5 and cardiovascular mortality (Section 7.2.10). These
associations are supported by a large U.S.-based epidemiologic study (i.e., Women’s Health Initiative
[WHI] study) that reports associations between PM 2.5 and CVDs among post-menopausal women
using a 1-yr avg PM 2.5 concentration (mean = 13.5 μg/m3) (Section 7.2). However, epidemiologic
studies that examined subclinical markers of CVD report inconsistent findings. Epidemiologic
studies have also provided some evidence for potential modification of the PM 2.5 -CVD association
when examining individual-level data, specifically smoking status and the use of anti-
hyperlipidemics. Although epidemiologic studies have not consistently detected effects on markers
of atherosclerosis due to long-term exposure to PM 2.5 , toxicological studies have provided strong
evidence for accelerated development of atherosclerosis in ApoE-/- mice exposed to CAPs and have
shown effects on coagulation, experimentally-induced hypertension, and vascular reactivity (Section
7.2.1.2). Evidence from toxicological studies provides biological plausibility and coherence with
studies of short-term exposure and cardiovascular morbidity and mortality, as well as with studies
that examined long-term exposure to PM 2.5 and cardiovascular mortality. Taken together, the
evidence from epidemiologic and toxicological studies is sufficient to conclude that a causal
relationship exists between long-term exposures to PM 2.5 and cardiovascular effects.
Respiratory Effects
Recent epidemiologic studies conducted in the U.S. and abroad provide evidence of
associations between long-term exposure to PM 2.5 and decrements in lung function growth,
increased respiratory symptoms, and asthma development in study locations with mean PM 2.5
concentrations ranging from 13.8 to 30 μg/m3 during the study periods (Section 7.3.1.1 and Section
7.3.2.1). These results are supported by studies that observed associations between long-term
exposure to PM 10 and an increase in respiratory symptoms and reductions in lung function growth in
areas where PM 10 is dominated by PM 2.5 . However, the evidence to support an association with
long-term exposure to PM 2.5 and respiratory mortality is limited (Figure 7-7). Subchronic and
chronic toxicological studies of CAPs, DE, roadway air and woodsmoke provide coherence and
biological plausibility for the effects observed in the epidemiologic studies. These toxicological
studies have presented some evidence for altered pulmonary function, mild inflammation, oxidative
responses, immune suppression, and histopathological changes including mucus cell hyperplasia
(Section 7.3). Exacerbated allergic responses have been demonstrated in animals exposed to DE and
wood smoke. In addition, pre- and postnatal exposure to ambient levels of urban particles was found
to affect lung development in an animal model. This finding is important because impaired lung
development is one mechanism by which PM exposure may decrease lung function growth in
children. Collectively, the evidence from epidemiologic and toxicological studies is sufficient to
conclude that a causal relationship is likely to exist between long-term exposures to PM 2.5
and respiratory effects.
Mortality
The recent epidemiologic literature reports associations between long-term PM 2.5 exposure
and increased risk of mortality. Mean PM 2.5 concentrations ranged from 13.2 to 29 μg/m3 during the
study period in these areas (Section 7.6). When evaluating cause-specific mortality, the strongest
evidence can be found when examining associations between PM 2.5 and cardiovascular mortality,
and positive associations were also reported between PM 2.5 and lung cancer mortality (Figure 7-7).
The cardiovascular mortality association has been confirmed further by the extended Harvard Six
Cities and American Cancer Society studies, which both report strong associations between long-
term exposure to PM 2.5 and cardiopulmonary and IHD mortality (Figure 7-7). Additional new
evidence from a study that used the WHI cohort found a particularly strong association between
long-term exposure to PM 2.5 and CVD mortality in post-menopausal women. Fewer studies have
evaluated the respiratory component of cardiopulmonary mortality, and, as a result, the evidence to
support an association with long-term exposure to PM 2.5 and respiratory mortality is limited (Figure
7-7). The evidence for cardiovascular and respiratory morbidity due to short- and long-term exposure
to PM 2.5 provides biological plausibility for cardiovascular- and respiratory-related mortality.
Collectively, the evidence is sufficient to conclude that a causal relationship exists between
long-term exposures to PM 2.5 and mortality.
Reproductive and Developmental Effects
Evidence is accumulating for PM 2.5 effects on low birth weight and infant mortality, especially
due to respiratory causes during the post-neonatal period. The mean PM 2.5 concentrations during the
study periods ranged from 5.3-27.4 μg/m3 (Section 7.4), with effects becoming more precise and
consistently positive in locations with mean PM 2.5 concentrations of 15 μg/m3 and above
(Section 7.4). Exposure to PM 2.5 was usually associated with greater reductions in birth weight than
exposure to PM 10 . The evidence from a few U.S. studies that investigated PM 10 effects on fetal
growth, which reported similar decrements in birth weight, provide consistency for the PM 2.5
associations observed and strengthen the interpretation that particle exposure may be causally related
to reductions in birth weight. The epidemiologic literature does not consistently report associations
between long-term exposure to PM and preterm birth, growth restriction, birth defects or decreased
sperm quality. Toxicological evidence supports an association between PM 2.5 and PM 10 exposure and
adverse reproductive and developmental outcomes, but provide little mechanistic information or
biological plausibility for an association between long-term PM exposure and adverse birth
outcomes (e.g., low birth weight or infant mortality). New evidence from animal toxicological
studies on heritable mutations is of great interest, and warrants further investigation. Overall, the
epidemiologic and toxicological evidence is suggestive of a causal relationship between long-
term exposures to PM 2.5 and reproductive and developmental outcomes.
Cancer, Mutagenicity, and Genotoxicity
Multiple epidemiologic studies have shown a consistent positive association between PM 2.5
and lung cancer mortality, but studies have generally not reported associations between PM 2.5 and
lung cancer incidence (Section 7.5). Animal toxicological studies have examined the potential
relationship between PM and cancer, but have not focused on specific size fractions of PM. Instead
they have examined ambient PM, wood smoke, and DEP. A number of studies indicate that ambient
urban PM, emissions from wood/biomass burning, emissions from coal combustion, and gasoline
and DE are mutagenic, and that PAHs are genotoxic. These findings are consistent with earlier
studies that concluded that ambient PM and PM from specific combustion sources are mutagenic and
genotoxic and provide biological plausibility for the results observed in the epidemiologic studies. A
limited number of epidemiologic and toxicological studies examined epigenetic effects, and
demonstrate that PM induces some changes in methylation. However, it has yet to be determined
how these alterations in the genome could influence the initiation and promotion of cancer.
Additionally, inflammation and immune suppression induced by exposure to PM may confer
susceptibility to cancer. Collectively, the evidence from epidemiologic studies, primarily those of
lung cancer mortality, along with the toxicological studies that show some evidence of the mutagenic
and genotoxic effects of PM is suggestive of a causal relationship between long-term
exposures to PM 2.5 and cancer.
2.3.2. Integration of PM 2.5 Health Effects
In epidemiologic studies, short-term exposure to PM 2.5 is associated with a broad range of
respiratory and cardiovascular effects, as well as mortality. For cardiovascular effects and mortality,
the evidence supports the existence of a causal relationship with short-term PM 2.5 exposure; while
the evidence indicates that a causal relationship is likely to exist between short-term PM 2.5 exposure
and respiratory effects. The effect estimates from recent and older U.S. and Canadian-based
epidemiologic studies that examined the relationship between short-term exposure to PM 2.5 and
health outcomes with mean 24-h avg PM 2.5 concentrations <17 μg/m3 are shown in Figure 2-1. A
number of different health effects are included in Figure 2-1 to provide an integration of the range of
effects by mean concentration, with a focus on cardiovascular and respiratory effects and all-cause
(nonaccidental) mortality (i.e., health effects categories with at least a suggestive causal
determination). A pattern of consistent positive associations with mortality and morbidity effects can
be seen in this figure. Mean PM 2.5 concentrations ranged from 6.1 to 16.8 μg/m3.in these study
locations.
Figure 2-1: Summary of effect estimates (per 10 μg/m3) by increasing concentration from U.S. studies examining the association between short-term exposure to PM 2.5 and cardiovascular and respiratory effects, and mortality, conducted in locations where the reported mean 24-h avg PM 2.5 concentrations were <17 μg/m3.
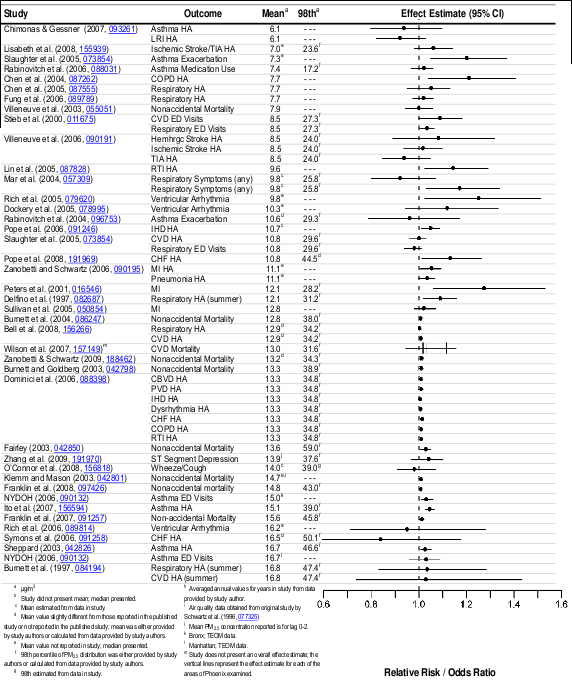
Long-term exposure to PM 2.5 has been associated with health outcomes similar to those found
in the short-term exposure studies, specifically for respiratory and cardiovascular effects and
mortality. As found for short-term PM 2.5 exposure, the evidence indicates that a causal relationship
exists between long-term PM 2.5 exposure and cardiovascular effects and mortality, and that a causal
relationship is likely to exist between long-term PM 2.5 exposure and effects on the respiratory
system.
Figure 2-2 highlights the findings of epidemiologic studies where the long-term mean PM 2.5
concentrations were ≤ 29 μg/m3. A range of health outcomes are displayed (including cardiovascular
mortality, all-cause mortality, infant mortaltiy, and bronchitis) ordered by mean concentration. The
range of mean PM 2.5 concentrations in these studies was 10.7-29 μg/m3 during the study periods.
Additional studies not included in this figure that focus on subclinical outcomes, such as changes in
lung function or atherosclerotic markers also report effects in areas with similar concentrations
(Sections 7.2 and 7.3). Although not highlighted in the summary figure, long-term PM 2.5 exposure
studies also provide evidence for reproductive and developmental effects (i.e., low birth weight) and
cancer (i.e., lung cancer mortality) in response to to exposure to PM 2.5.
Figure 2-2: Summary of effect estimates (per 10 μg/m3) by increasing concentration from U.S. studies examining the association between long-term exposure to PM 2.5 and cardiovascular and respiratory effects, and mortality.
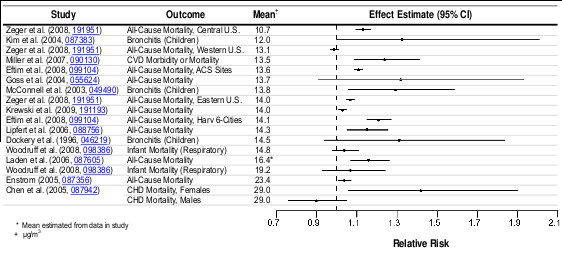
The observations from both the short- and long-term exposure studies are supported by
experimental findings of PM 2.5 -induced subclinical and clinical cardiovascular effects.
Epidemiologic studies have shown an increase in ED visits and hospital admissions for IHD upon
exposure to PM 2.5 . These effects are coherent with the changes in vasomotor function and ST-
segment depression observed in both toxicological and controlled human exposure studies. It has
been postulated that exposure to PM 2.5 can lead to myocardial ischemia through an effect on the
autonomic nervous system or by altering vasomotor function. PM-induced systemic inflammation,
oxidative stress and/or endothelial dysfunction may contribute to altered vasomotor function. These
effects have been demonstrated in recent animal toxicological studies, along with altered
microvascular reactivity, altered vessel tone, and reduced blood flow during ischemia. Toxicological
studies demonstrating increased right ventricular pressure and diminished cardiac contractility also
provide biological plausibility for the associations observed between PM 2.5 and CHF in
epidemiologic studies.
Thus, the overall evidence from the short-term epidemiologic, controlled human exposure, and
toxicological studies evaluated provide coherence and biological plausibility for cardiovascular
effects related to myocardial ischemia and CHF. Coherence in the cardiovascular effects observed
can be found in long-term exposure studies, especially for CVDs among post-menopausal women.
Additional studies provide limited evidence for subclinical measures of atherosclerosis in
epidemiologic studies with stronger evidence from toxicological studies that have demonstrated
accelerated development of atherosclerosis in ApoE-/- mice exposed to PM 2.5 CAPs along with
effects on coagulation, experimentally-induced hypertension, and vascular reactivity. Repeated acute
responses to PM may lead to cumulative effects that manifest as chronic disease, such as
atherosclerosis. Contributing factors to atherosclerosis development include systemic inflammation,
endothelial dysfunction, and oxidative stress all of which are associated with PM 2.5 exposure.
However, it has not yet been determined whether PM initiates or promotes atherosclerosis. The
evidence from both short- and long-term exposure studies on cardiovascular morbidity provide
coherence and biological plausibility for the cardiovascular mortality effects observed when
examining both exposure durations. In addition, cardiovascular hospital admission and mortality
studies that examined the PM 10 concentration-response relationship found evidence of a log-linear
no-threshold relationship between PM exposure and cardiovascular-related morbidity (Section 6.2)
and mortality (Section 6.5).
Epidemiologic studies have also reported respiratory effects related to short-term exposure to
PM 2.5 , which include increased ED visits and hospital admissions, as well as alterations in lung
function and respiratory symptoms in asthmatic children. These respiratory effects were found to be
generally robust to the inclusion of gaseous pollutants in copollutant models with the strongest
evidence from the higher powered studies (Figure 6-9 and Figure 6-15). Consistent positive
associations were also reported between short-term exposure to PM 2.5 and respiratory mortality in
epidemiologic studies. However, uncertainties exist in the PM 2.5 -respiratory mortality associations
reported due to the limited number of studies that examined potential confounders of the PM 2.5 -
respiratory mortality relationship, and the limited information regarding the biological plausibility of
the clinical and subclinical respiratory outcomes observed in the epidemiologic and controlled
human exposure studies (Section 6.3) resulting in the progression to PM 2.5 -induced respiratory
mortality. Important new findings, which support the PM 2.5 -induced respiratory effects mentioned
above, include associations with post-neonatal (between 1 mo and 1 yr of age) respiratory mortality.
Controlled human exposure studies provide some support for the respiratory findings from
epidemiologic studies, with demonstrated increases in pulmonary inflammation following short-term
exposure. However, there is limited and inconsistent evidence of effects in response to controlled
exposures to PM 2.5 on respiratory symptoms or pulmonary function among healthy adults or adults
with respiratory disease. Long-term exposure epidemiologic studies provide additional evidence for
PM 2.5 -induced respiratory morbidity, but little evidence for an association with respiratory mortality.
These epidemiologic morbidity studies have found decrements in lung function growth, as well as
increased respiratory symptoms, and asthma. Toxicological studies provide coherence and biological
plausibility for the respiratory effects observed in response to short and long-term exposures to PM
by demonstrating a wide array of biological responses including: altered pulmonary function, mild
pulmonary inflammation and injury, oxidative responses, and histopathological changes in animals
exposed by inhalation to PM 2.5 derived from a wide variety of sources. In some cases, prolonged
exposures led to adaptive responses. Important evidence was also found in an animal model for
altered lung development following pre- and post-natal exposure to urban air, which may provide a
mechanism to explain the reduction in lung function growth observed in children in response to
long-term exposure to PM.
Additional respiratory-related effects have been tied to allergic responses. Epidemiologic
studies have provided evidence for increased hospital admissions for allergic symptoms (e.g.,
allergic rhinitis) in response to short- and long-term exposure to PM 2.5 . Panel studies also positively
associate long-term exposure to PM 2.5 and PM 10 with indicators of allergic sensitization. Controlled
human exposure and toxicological studies provide coherence for the exacerbation of allergic
symptoms, by showing that PM 2.5 can promote allergic responses and intensify existing allergies.
Allergic responses require repeated exposures to antigen over time and co-exposure to an adjuvant
(possibly DE particles or UF CAPs) can enhance this response. Allergic sensitization often underlies
allergic asthma, characterized by inflammation and AHR. In this way, repeated or chronic exposures
involving multifactorial responses (immune system activation, oxidative stress, inflammation) can
lead to irreversible outcomes. Epidemiologic studies have also reported evidence for increased
hospital admissions for respiratory infections in response to both short- and long-term exposures to
PM 2.5 . Toxicological studies suggest that PM impairs innate immunity, which is the first line of
defense against infection, providing coherence for the respiratory infection effects observed in
epidemiologic studies.
The difference in effects observed across studies and between cities may be attributed, at least
in part, to the differences in PM composition across the U.S. Differences in PM toxicity may result
from regionally varying PM composition and size distribution, which in turn reflects differences in
sources and PM volatility. A person’s exposure to ambient PM will also vary due to regional
differences in personal activity patterns, microenvironmental characteristics and the spatial
variability of PM concentrations in urban areas. Regional differences in PM 2.5 composition are
outlined briefly in Section 2.1 above and in more detail in Section 3.5. An examination of data from
the CSN indicates that East-West gradients exist for a number of PM components. Specifically, SO 4 2-
concentrations are higher in the East, OC constitutes a larger fraction of PM in the West, and NO 3 -
concentrations are highest in the valleys of central California and during the winter in the Midwest.
However, the available evidence and the limited amount of city-specific speciated PM 2.5 data does
not allow conclusions to be drawn that specifically differentiate effects of PM in different locations.
It remains a challenge to determine relationships between specific constituents, combinations
of constituents, or sources of PM 2.5 and the various health effects observed. Source apportionment
studies of PM 2.5 have attempted to decipher some of these relationships and in the process have
identified associations between multiple sources and various respiratory and cardiovascular health
effects, as well as mortality. Although different source apportionment methods have been used across
these studies, the methods used have been evaluated and found generally to identify the same
sources and associations between sources and health effects (Section 6.6). While uncertainty
remains, it has been recognized that many sources and components of PM 2.5 contribute to health
effects. Overall, the results displayed in Table 6-18 indicate that many constituents of PM 2.5 can be
linked with multiple health effects, and the evidence is not yet sufficient to allow differentiation of
those constituents or sources that are more closely related to specific health outcomes.
Variability in the associations observed across PM 2.5 epidemiologic studies may be due in part
to exposure error related to the use of county-level air quality data. Because western U.S. counties
tend to be much larger and more topographically diverse than eastern U.S. counties, the day-to-day
variations in concentration at one site, or even for the average of several sites, may not correlate well
with the day-to-day variations in all parts of the county. For example, site-to-site correlations as a
function of distance between sites (Section 3.5.1.2) fall off rapidly with distance in Los Angeles, but
high correlations extend to larger distances in eastern cities such as Boston and Pittsburgh. These
differences may be attributed to a number of factors including topography, the built environment,
climate, source characteristics, ventilation usage, and personal activity patterns. For instance,
regional differences in climate and infrastructure can affect time spent outdoors or indoors, air
conditioning usage, and personal activity patterns. Characteristics of housing stock may also cause
regional differences in effect estimates because new homes tend to have lower infiltration factors
than older homes. Biases and uncertainties in exposure estimates resulting from these aspects can, in
turn, cause bias and uncertainty in associated health effects estimates.
The new evidence reviewed in this ISA greatly expands upon the evidence available in the
2004 PM AQCD particularly in providing greater understanding of the underlying mechanisms for
PM 2.5 induced cardiovascular and respiratory effects for both short- and long-term exposures. Recent
studies have provided new evidence linking long-term exposure to PM 2.5 with cardiovascular
outcomes that has expanded upon the continuum of effects ranging from the more subtle subclinical
measures to cardiopulmonary mortality.
2.3.3. Exposure to PM10-2.5
2.3.3.1. Effects of Short-Term Exposure to PM 10-2.5
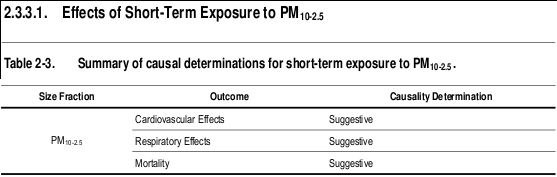
Cardiovascular Effects
Generally positive associations were reported between short-term exposure to PM 10-2.5 and
hospital admissions or ED visits for cardiovascular causes. These results are supported by a large
U.S. multicity study of older adults that reported PM 10-2.5 associations with CVD hospital
admissions, and only a slight reduction in the PM 10-2.5 risk estimate when included in a copollutant
model with PM 2.5 (Section 6.2.10). The PM 10-2.5 associations with cardiovascular hospital admissions
and ED visits were observed in study locations with mean 24-h avg PM 10-2.5 concentrations ranging
from 7.4 to 13 μg/m3. These results are supported by the associations observed between PM 10-2.5 and
cardiovascular mortality in areas with 24-h avg PM 10-2.5 concentrations ranging from 6.1-16.4 μg/m3
(Section 6.2.11). The results of the epidemiologic studies were further confirmed by studies that
examined dust storm events, which contain high concentrations of crustal material, and found an
increase in cardiovascular-related ED visits and hospital admissions. Additional epidemiologic
studies have reported PM 10-2.5 associations with other cardiovascular health effects including
supraventricular ectopy and changes in HRV (Section 6.2.1.1). Although limited in number, studies
of controlled human exposures provide some evidence to support the alterations in HRV observed in
the epidemiologic studies (Section 6.2.1.2). The few toxicological studies that examined the effect of
PM 10-2.5 on cardiovascular health effects used IT instillation due to the technical challenges in
exposing rodents via inhalation to PM 10-2.5 , and, as a result, provide only limited evidence on the
biological plausibility of PM 10-2.5 induced cardiovascular effects. The potential for PM 10-2.5 to elicit
an effect is supported by dosimetry studies, which show that a large proportion of inhaled particles in
the 3-6 micron (d ae ) range can reach and deposit in the lower respiratory tract, particularly the
tracheobronchial (TB) airways (Figures 4-3 and 4-4). Collectively, the evidence from epidemiologic
studies, along with the more limited evidence from controlled human exposure and toxicological
studies is suggestive of a causal relationship between short-term exposures to PM 10-2.5
and cardiovascular effects.
Respiratory Effects
A number of recent epidemiologic studies conducted in Canada and France found consistent,
positive associations between respiratory ED visits and hospital admissions and short-term exposure
to PM 10-2.5 in studies with mean 24-h avg concentrations ranging from 5.6-16.2 μg/m3 (Section 6.3.8) .
In these studies, the strongest relationships were observed among children, with less consistent
evidence for adults and older adults (i.e., ≥ 65). In a large multicity study of older adults, PM 10-2.5
was positively associated with respiratory hospital admissions in both single and copollutant models
with PM 2.5 . In addition, a U.S.-based multicity study found evidence for an increase in respiratory
mortality upon short-term exposure to PM 10-2.5 , but these associations have not been consistently
observed in single-city studies (Section 6.3.9). A limited number of epidemiologic studies have
focused on specific respiratory morbidity outcomes, and found no evidence of an association with
lower respiratory symptoms, wheeze, and medication use (Section 6.3.1.1). While controlled human
exposure studies have not observed an effect on lung function or respiratory symptoms in healthy or
asthmatic adults in response to short-term exposure to PM 10-2.5 , healthy volunteers have exhibited an
increase in markers of pulmonary inflammation. Toxicological studies using inhalation exposures are
still lacking, but pulmonary injury has been observed in animals after IT instillation exposure
(Section 6.3.5.3). In some cases, PM 10-2.5 was found to be more potent than PM 2.5 and effects were
not attributable to endotoxin. Both rural and urban PM 10-2.5 have induced inflammation and injury
responses in rats or mice exposed via IT instillation, making it difficult to distinguish the health
effects of PM 10-2.5 from different environments. Overall, epidemiologic studies, along with the
limited number of controlled human exposure and toxicological studies that examined PM 10-2.5
respiratory effects provide evidence that is suggestive of a causal relationship between short-
term exposures to PM 10-2.5 and respiratory effects.
Mortality
The majority of studies evaluated in this review provide some evidence for mortality
associations with PM 10-2.5 in areas with mean 24-h avg concentrations ranging from 6.1-16.4 μg/m3.
However, uncertainty surrounds the PM 10-2.5 associations reported in the studies evaluated due to the
different methods used to estimate PM 10-2.5 concentrations across studies (e.g., direct measurement
of PM 10-2.5 using dichotomous samplers, calculating the difference between PM 10 and PM 2.5
concentrations). In addition, only a limited number of PM 10-2.5 studies have investigated potential
confounding by gaseous copollutants or the influence of model specification on PM 10-2.5 risk
estimates.
A new U.S.-based multicity study, which estimated PM 10-2.5 concentrations by calculating the
difference between the county-average PM 10 and PM 2.5 , found associations between PM 10-2.5 and
mortality across the U.S., including evidence for regional variability in PM 10-2.5 risk estimates
(Section 6.5.2.3). Additionally, the U.S.-based multicity study provides preliminary evidence for
greater effects occurring during the warmer months (i.e., spring and summer). A multicity Canadian
study provides additional evidence for an association between short-term exposure to PM 10-2.5 and
mortality (Section 6.5.2.3). Although consistent positive associations have been observed across both
multi- and single-city studies, more data are needed to adequately characterize the chemical and
biological components that may modify the potential toxicity of PM 10-2.5 and compare the different
methods used to estimate exposure. Overall, the evidence evaluated is suggestive of a causal
relationship between short-term exposures to PM 10-2.5 and mortality.
2.3.4. Integration of PM 10-2.5 Effects
Epidemiologic, controlled human exposure, and toxicological studies have provided evidence that is
suggestive for relationships between short-term exposure to PM 10-2.5 and cardiovascular effects,
respiratory effects, and mortality. Conclusions regarding causation for the various health effects and
outcomes were made for PM 10-2.5 as a whole regardless of origin, since PM 10-2.5 -related effects have
been demonstrated for a number of different environments (e.g., cities reflecting a wide range of
environmental conditions). Associations between short-term exposure to PM 10-2.5 and cardiovascular
and respiratory effects, and mortality have been observed in locations with mean PM 10-2.5
concentrations ranging from 5.6 to 33.2 μg/m3, and maximum PM 10-2.5 concentrations ranging from
24.6 to 418.0 μg/m3) (Figure 2-3). A number of different health effects are included in Figure 2-3 to
provide an integration of the range of effects by mean concentration, with a focus on cardiovascular
and respiratory effects, and mortality (i.e., health effects categories with at least a suggestive causal
determination). To date, a sufficient amount of evidence does not exist in order to draw conclusions
regarding the health effects and outcomes associated with long-term exposure to PM 10-2.5 .
In epidemiologic studies, associations between short-term exposure to PM 10-2.5 and
cardiovascular outcomes (i.e., IHD hospital admissions, supraventricular ectopy, and changes in
HRV) have been found that are similar in magnitude to those observed in PM 2.5 studies. Controlled
human exposure studies have also observed alterations in HRV, providing consistency and coherence
for the effects observed in the epidemiologic studies. To date, only a limited number of toxicological
studies have been conducted to examine the effects of PM 10-2.5 on cardiovascular effects. All of these
studies involved IT instillation due to the technical challenges of using PM 10-2.5 for rodent inhalation
studies. As a result, the toxicological studies evaluated provide limited biological plausibility for the
PM 10-2.5 effects observed in the epidemiologic and controlled human exposure studies.
Figure 2-3. Summary of U.S. studies examining the association between short-term exposure to PM 10-2.5 and cardiovascular morbidity/mortality and respiratory morbidity/mortality. All effect estimates have been standardized to reflect a10 μg/m3 increase in mean 24-h avg PM 10-2.5 concentration and ordered by increasing concentration.
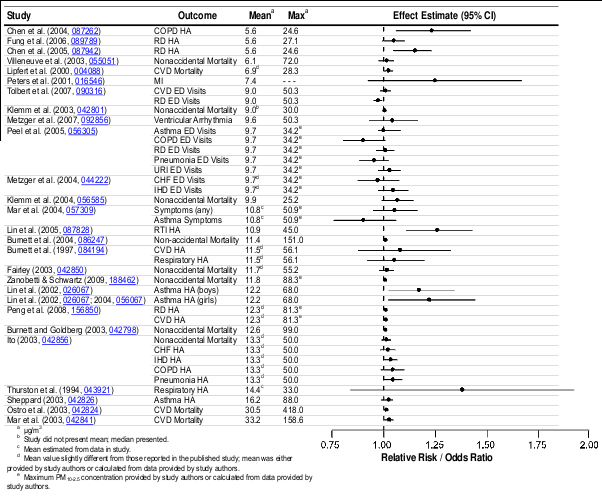
Limited evidence is available from epidemiologic studies for respiratory health effects and
outcomes in response to short-term exposure to PM 10-2.5 . An increase in respiratory hospital
admissions and ED visits has been observed, but primarily in studies conducted in Canada and
Europe. In addition, associations are not reported for lower respiratory symptoms, wheeze, or
medication use. Controlled human exposure studies have not observed an effect on lung function or
respiratory symptoms in healthy or asthmatic adults, but healthy volunteers have exhibited
pulmonary inflammation. The toxicological studies (all IT instillation) provide evidence of
pulmonary injury and inflammation. In some cases, PM 10-2.5 was found to be more potent than PM 2.5
and effects were not solely attributable to endotoxin.
Currently, a national network is not in place to monitor PM 10-2.5 concentrations. As a result,
uncertainties surround the concentration at which the observed associations occur. Ambient
concentrations of PM 10-2.5 are generally determined by the subtraction of PM 10 and PM 2.5
measurements, using various methods. For example, some epidemiologic studies estimate PM 10-2.5
by taking the difference between collocated PM 10 and PM 2.5 monitors while other studies have taken
the difference between county average PM 10 and PM 2.5 concentrations. Moreover, there are potential
differences among operational flow rates and temperatures for PM 10 and PM 2.5 monitors used to
calculate PM 10-2.5 . Therefore, there is greater error in ambient exposure to PM 10-2.5 compared to
PM 2.5 . This would tend to increase uncertainty and make it more difficult to detect effects of PM 10-2.5
in epidemiologic studies. In addition, the various differences between eastern and western U.S.
counties can lead to exposure misclassification, and the potential underestimation of effects in
western counties (as discussed for PM 2.5 in Section 2.3.2).
It is also important to note that the chemical composition of PM 10-2.5 can vary considerably by
location, but city-specific speciated PM 10-2.5 data are limited. PM 10-2.5 may contain Fe, Si, Al, and
base cations from soil, plant and insect fragments, pollen, fungal spores, bacteria, and viruses, as
well as fly ash, brake lining particles, debris, and automobile tire fragments.
The 2004 PM AQCD presented the limited amount of evidence available that examined the
potential association between exposure to PM 10-2.5 and health effects and outcomes. The current
evidence, primarily from epidemiologic studies, builds upon the results from the 2004 PM AQCD
and indicates that short-term exposure to PM 10-2.5 is associated with effects on both the
cardiovascular and respiratory systems. However, variability in the chemical and biological
composition of PM 10-2.5 , limited evidence regarding effects of the various components of PM 10-2.5 ,
and lack of clearly defined biological mechanisms for PM 10-2.5 -related effects are important sources
of uncertainty.
2.3.5. Exposure to UFPs
2.3.5.1. Effects of Short-Term Exposure to UFPs
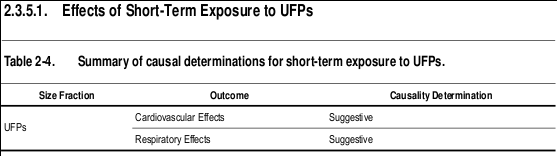
Cardiovascular Effects
Controlled human exposure studies provide the majority of the evidence for cardiovascular
health effects in response to short-term exposure to UFPs. While there are a limited number of
studies that have examined the association between UFPs and cardiovascular morbidity, there is a
larger body of evidence from studies that exposed subjects to fresh DE, which is typically dominated
by UFPs. These studies have consistently demonstrated changes in vasomotor function following
exposure to atmospheres containing relatively high concentrations of particles (Section 6.2.4.2).
Markers of systemic oxidative stress have also been observed to increase after exposure to various
particle types that are predominantly in the UFP size range. In addition, alterations in HRV
parameters have been observed in response to controlled human exposure to UF CAPs, with
inconsistent evidence for changes in markers of blood coagulation following exposure to UF CAPs
and DE (Sections 6.2.1.2 and 6.2.8.2). A few toxicological studies have also found consistent
changes in vasomotor function, which provides coherence with the effects demonstrated in the
controlled human exposure studies (Section 6.2.4.3). Additional UFP-induced effects observed in
toxicological studies include alterations in HRV, with less consistent effects observed for systemic
inflammation and blood coagulation. Only a few epidemiologic studies have examined the effect of
UFPs on cardiovascular morbidity and collectively they found inconsistent evidence for an
association between UFPs and CVD hospital admissions, but some positive associations for
subclinical cardiovascular measures (i.e., arrhythmias and supraventricular beats) (Section 6.2.2.1).
These studies were conducted in the U.S. and Europe in areas with mean particle number
concentration ranging from ~8,500 to 36,000 particles/cm3. However, UFP number concentrations
are highly variable (i.e., concentrations drop off quickly from the road compared to accumulation
mode particles), and therefore, more subject to exposure error than accumulation mode particles. In
conclusion, the evidence from the studies evaluated is suggestive of a causal relationship
between short-term exposures to UFPs and cardiovascular effects.
Respiratory Effects
A limited number of epidemiologic studies have examined the potential association between
short-term exposure to UFPs and respiratory morbidity. Of the studies evaluated, there is limited, and
inconsistent evidence for an association between short-term exposure to UFPs and respiratory
symptoms, as well as asthma hospital admissions in locations a median particle number
concentration of ~6,200 to a mean of 38,000 particles/cm3 (Section 6.3.10). The spatial and temporal
variability of UFPs also affects these associations. Toxicological studies have reported respiratory
effects including oxidative, inflammatory, and allergic responses using a number of different UFP
types (Section 6.3). Although controlled human exposure studies have not extensively examined the
effect of UFPs on respiratory outcomes, a few studies have observed small UFP-induced
asymptomatic decreases in pulmonary function. Markers of pulmonary inflammation have been
observed to increase in healthy adults following controlled exposures to UFPs, particularly in studies
using fresh DE. However, it is important to note that for both controlled human exposure and animal
toxicological studies of exposures to fresh DE, the relative contributions of gaseous copollutants to
the respiratory effects observed remain unresolved. Thus, the current collective evidence is
suggestive of a causal relationship between short-term exposures to UFPs and
respiratory effects.
2.3.6. Integration of UFP Effects
The controlled human exposure studies evaluated have consistently demonstrated effects on
vasomotor function and systemic oxidative stress with additional evidence for alterations in HRV
parameters in response to exposure to UF CAPs. The toxicological studies provide coherence for the
changes in vasomotor function observed in the controlled human exposure studies. Epidemiologic
studies are limited because a national network is not in place to measure UFP in the U.S. UFP
concentrations are spatially and temporally variable, which would increase uncertainty and make it
difficult to detect associations between health effects and UFPs in epidemiologic studies. In addition,
data on the composition of UFPs, the spatial and temporal evolution of UFP size distribution and
chemical composition, and potential effects of UFP constituents are sparse.
More limited evidence is available regarding the effect of UFPs on respiratory effects.
Controlled human exposure studies have not extensively examined the effect of UFPs on respiratory
measurements, but a few studies have observed small decrements in pulmonary function and
increases in pulmonary inflammation. Additional effects including oxidative, inflammatory, and pro-
allergic outcomes have been demonstrated in toxicological studies. Epidemiologic studies have
found limited and inconsistent evidence for associations between UFPs and respiratory effects.
Overall, a limited number of studies have examined the association between exposure to UFPs
and morbidity and mortality. Of the studies evaluated, controlled human exposure and toxicological
studies provide the most evidence for UFP-induced cardiovascular and respiratory effects; however,
many studies focus on exposure to DE. As a result, it is unclear if the effects observed are due to
UFP, larger particles (i.e., PM 2.5 ), or the gaseous components of DE. Additionally, UF CAPs systems
are limited as the atmospheric UFP composition is modified when concentrated, which adds
uncertainty to the health effects observed in controlled human exposure studies (Section 1.5.3).
2.4. Policy Relevant Considerations
2.4.1. Potentially Susceptible Populations
Upon evaluating the association between short- and long-term exposure to PM and various
health outcomes, studies also attempted to identify populations that are more susceptible to PM (i.e.,
populations that have a greater likelihood of experiencing health effects related to exposure to an air
pollutant (e.g., PM) due to a variety of factors including, but not limited to: genetic or developmental
factors, race, gender, life stage, lifestyle (e.g., smoking status and nutrition) or preexisting disease; as
well as, population-level factors that can increase an individual's exposure to an air pollutant (e.g.,
PM) such as socioeconomic status [SES], which encompasses reduced access to health care, low
educational attainment, residential location, and other factors). These studies did so by conducting
stratified analyses; by examining effects in individuals with an underlying health condition; or by
developing animal models that mimic the pathophysiologic conditions associated with an adverse
health effect. In addition, numerous studies that focus on only one potentially susceptible population
provide supporting evidence on whether a population is susceptible to PM exposure. These studies
identified a multitude of factors that could potentially contribute to whether an individual is
susceptible to PM (Table 8-2). Although studies have primarily used exposures to PM 2.5 or PM 10 , the
available evidence suggests that the identified factors may also enhance susceptibility to PM 10-2.5 .
The examination of susceptible populations to PM exposure allows for the NAAQS to provide an
adequate margin of safety for both the general population and for susceptible populations.
During specific periods of life (i.e., childhood and advanced age), individuals may be more
susceptible to environmental exposures, which in turn can render them more susceptible to PM-
related health effects. An evaluation of age-related health effects suggests that older adults have
heightened responses for cardiovascular morbidity with PM exposure. In addition, epidemiologic
and toxicological studies provide evidence that indicates children are at an increased risk of PM-
related respiratory effects. It should be noted that the health effects observed in children could be
initiated by exposures to PM that occurred during key windows of development, such as in utero.
Epidemiologic studies that focus on exposures during development have reported inconsistent
findings (Section 7.4), but a recent toxicological study suggests that inflammatory responses in
pregnant women due to exposure to PM could result in health effects in the developing fetus.
Epidemiologic studies have also examined whether additional factors, such as gender, race, or
ethnicity modify the association between PM and morbidity and mortality outcomes. Although
gender and race do not seem to modify PM risk estimates, limited evidence from two studies
conducted in California suggest that Hispanic ethnicity may modify the association between PM and
mortality.
Recent epidemiologic and toxicological studies provided evidence that individuals with null
alleles or polymorphisms in genes that mediate the antioxidant response to oxidative stress (i.e.,
GSTM1), regulate enzyme activity (i.e., MTHFR and cSHMT), or regulate levels of procoagulants
(i.e., fibrinogen) are more susceptible to PM exposure. However, some studies have shown that
polymorphisms in genes (e.g., HFE) can have a protective effect against effects of PM exposure.
Additionally, preliminary evidence suggests that PM exposure can impart epigenetic effects (i.e.,
DNA methylation); however, this requires further investigation.
Collectively, the evidence from epidemiologic and toxicological, and to a lesser extent,
controlled human exposure studies, indicate increased susceptibility of individuals with underlying
CVDs and respiratory illnesses (i.e., asthma) to PM exposure. Controlled human exposure and
toxicological studies provide additional evidence for increased PM-related cardiovascular effects in
individuals with underlying respiratory health conditions.
Recently studies have begun to examine the influence of preexisting chronic inflammatory
conditions, such as diabetes and obesity, on PM-related health effects. These studies have found
some evidence for increased associations for cardiovascular outcomes along with pathophysiologic
alterations in markers of inflammation, oxidative stress, and acute phase response. However, more
research is needed to thoroughly examine the affect of PM exposure on obese individuals and to
identify the biological pathway(s) that could increase the susceptibility of diabetic and obese
individuals to PM.
There is also evidence that SES, measured using surrogates such as educational attainment or
residential location, modifies the association between PM and morbidity and mortality outcomes. In
addition, nutritional status, another surrogate measure of SES, has been shown to have protective
effects against PM exposure in individuals that have a higher intake of some vitamins and nutrients.
Overall, the epidemiologic, controlled human exposure, and toxicological studies evaluated in
this review provide evidence for increased susceptibility for various populations, including children
and older adults, people with pre-existing cardiopulmonary diseases, and people with lower SES.
2.4.2. Lag Structure of PM-Morbidity and PM-Mortality Associations
Epidemiologic studies have evaluated the time-frame in which exposure to PM can impart a
health effect. PM exposure-response relationships can potentially be influenced by a multitude of
factors, such as the underlying susceptibility of an individual (e.g., age, pre-existing diseases), which
could increase or decrease the lag times observed.
An attempt has been made to identify whether certain lag periods are more strongly associated
with specific health outcomes. The epidemiologic evidence evaluated in the 2004 PM AQCD
supported the use of lags of 0-1 days for cardiovascular effects and longer moving averages or
distributed lags for respiratory diseases (U.S. EPA, 2004, 056905). However, currently, little
consensus exists as to the most appropriate a priori lag times to use when examining morbidity and
mortality outcomes. As a result, many investigators have chosen to examine the lag structure of
associations between PM concentration and health outcome instead of focusing on a priori lag times.
This approach is informative because if effects are cumulative, higher overall risks may exist than
would be observed for any given single-day lag.
2.4.2.1. PM-Cardiovascular Morbidity Associations
Most of the studies evaluated that examined the association between cardiovascular hospital
admissions and ED visits report associations with short-term PM exposure at lags 0- to 2-days, with
more limited evidence for shorter durations (i.e., hours) between exposure and response for some
health effects (e.g., onset of MI) (Section 6.2.10). However, these studies have rarely examined
alternative lag structures. Controlled human exposure and toxicological studies provide biological
plausibility for the health effects observed in the epidemiologic studies at immediate or concurrent
day lags. Although the majority of the evidence supports shorter lag times for cardiovascular health
effects, a recent study has provided preliminary evidence suggesting that longer lag times (i.e., 14-
day distributed lag model) may be plausible for non-ischemic cardiovascular conditions
(Section 6.2.10). Panel studies of short-term exposure to PM and cardiovascular endpoints have also
examined the time frame from exposure to health effect using a wide range of lag times. Studies of
ECG changes indicating ischemia show effects at lags from several hours to 2 days, while lag times
ranging from hours to several week moving averages have been observed in studies of arrhythmias,
vasomotor function and blood markers of inflammation, coagulation and oxidative stress
(Section 6.2). The longer lags observed in these panel studies may be explained if the effects of PM
are cumulative. Although few studies of cumulative effects have been conducted, toxicological
studies have demonstrated PM-dependent progression of atherosclerosis. It should be noted that PM
exposure could also lead to an acute event (e.g., infarction or stroke) in individuals with
atherosclerosis that may have progressed in response to cumulative PM exposure. Therefore, effects
have been observed at a range of lag periods from a few hours to several days with no clear evidence
for any lag period having stronger associations then another.
2.4.2.2. PM-Respiratory Morbidity Associations
Generally, recent studies of respiratory hospital admissions that evaluate multiple lags, have
found effect sizes to be larger when using longer moving averages or distributed lag models. For
example, when examining hospital admissions for all respiratory diseases among older adults, the
strongest associations were observed when using PM concentrations 2 days prior to the hospital
admission (Section 6.3.8). Longer lag periods were also found to be most strongly associated with
asthma hospital admissions and ED visits in children (3-5 days) with some evidence for more
immediate effects in older adults (lags of 0 and 1 day), but these observations were not consistent
across studies (Section 6.3.8). These variable results could be due to the biological complexity of
asthma, which inhibits the identification of a specific lag period. The longer lag times identified in
the epidemiologic studies evaluated are biologically plausible considering that PM effects on allergic
sensitization and lung immune defenses have been observed in controlled human exposure and
toxicological studies. These effects could lead to respiratory illnesses over a longer time course (e.g.,
within several days respiratory infection may become evident, resulting in respiratory symptoms or a
hospital admission). However, inflammatory responses, which contribute to some forms of asthma,
may result in symptoms requiring medical care within a shorter time frame (e.g., 0-1 days).
2.4.2.3. PM-Mortality Associations
Epidemiologic studies that focused on the association between short-term PM exposure and
mortality (i.e., all-cause, cardiovascular, and respiratory) mostly examined a priori lag structures of
either 1 or 0-1 days. Although mortality studies do not often examine alternative lag structures, the
selection of the aforementioned a priori lag days has been confirmed in additional studies, with the
strongest PM-mortality associations consistently being observed at lag 1 and 0-1-days (Section 6.5).
However, of note is recent evidence for larger effect estimates when using a distributed lag model.
Epidemiologic studies that examined the association between long-term exposure to PM and
mortality have also attempted to identify the latency period from PM exposure to death
(Section 7.6.4). Results of the lag comparisons from several cohort studies indicate that the effects of
changes in exposure on mortality are seen within five years, with the strongest evidence for effects
observed within the first two years. Additionally, there is evidence, albeit from one study, that the
mortality effect had larger cumulative effects spread over the follow-up year and three preceding
years.
2.4.3. PM Concentration-Response Relationship
An important consideration in characterizing the PM-morbidity and mortality association is
whether the concentration-response relationship is linear across the full concentration range that is
encountered or if there are concentration ranges where there are departures from linearity
(i.e., nonlinearity). In this ISA studies have been identified that attempt to characterize the shape of
the concentration-response curve along with possible PM “thresholds” (i.e., levels which PM
concentrations must exceed in order to elicit a health response). The epidemiologic studies evaluated
that examined the shape of the concentration-response curve and the potential presence of a
threshold have focused on cardiovascular hospital admissions and ED visits and mortality associated
with short-term exposure to PM 10 and mortality associated with long-term exposure to PM 2.5 .
A limited number of studies have been identified that examined the shape of the PM-
cardiovascular hospital admission and ED visit concentration-response relationship. Of these studies,
some conducted an exploratory analysis during model selection to determine if a linear curve most
adequately represented the concentration-response relationship; whereas, only one study conducted
an extensive analysis to examine the shape of the concentration-response curve at different
concentrations (Section 6.2.10.10). Overall, the limited evidence from the studies evaluated supports
the use of a no-threshold, log-linear model, which is consistent with the observations made in studies
that examined the PM-mortality relationship.
Although multiple studies have previously examined the PM-mortality concentration-response
relationship and whether a threshold exists, more complex statistical analyses continue to be
developed to analyze this association. Using a variety of methods and models, most of the studies
evaluated support the use of a no-threshold, log-linear model; however, one study did observe
heterogeneity in the shape of the concentration-response curve across cities (Section 6.5). Overall,
the studies evaluated further support the use of a no-threshold log-linear model, but additional issues
such as the influence of heterogeneity in estimates between cities, and the effect of seasonal and
regional differences in PM on the concentration-response relationship still require further
investigation.
In addition to examining the concentration-response relationship between short-term exposure
to PM and mortality, Schwartz et al. (2008, 156963) conducted an analysis of the shape of the
concentration-response relationship associated with long-term exposure to PM. Using a variety of
statistical methods, the concentration-response curve was found to be indistinguishable from linear,
and, therefore, little evidence was observed to suggest that a threshold exists in the association
between long-term exposure to PM 2.5 and the risk of death (Section 7.6)
2.4.4. PM Sources and Constituents Linked to Health Effects
Recent epidemiologic, toxicological, and controlled human exposure studies have evaluated
the health effects associated with ambient PM constituents and sources, using a variety of
quantitative methods applied to a broad set of PM constituents, rather than selecting a few
constituents a priori (Section 6.6). There is some evidence for trends and patterns that link particular
ambient PM constituents or sources with specific health outcomes, but there is insufficient evidence
to determine whether these patterns are consistent or robust.
For cardiovascular effects, multiple outcomes have been linked to a PM 2.5 crustal/soil/road
dust source, including cardiovascular mortality and ST-segment changes. Additional studies have
reported associations between other sources (i.e., traffic and wood smoke/vegetative burning) and
cardiovascular outcomes (i.e., mortality and ED visits). Studies that only examined the effects of
individual PM 2.5 constituents found evidence for an association between EC and cardiovascular
hospital admissions and cardiovascular mortality. Many studies have also observed associations
between other sources (i.e., salt, secondary SO 4 2–/long-range transport, other metals) and
cardiovascular effects, but at this time, there does not appear to be a consistent trend or pattern of
effects for those factors.
There is less consistent evidence for associations between PM sources and respiratory health
effects, which may be partially due to the fact that fewer source apportionment studies have been
conducted that examined respiratory-related outcomes (e.g., hospital admissions) and measures (e.g.,
lung function). However, there is some evidence for associations between respiratory ED visits and
decrements in lung function with secondary SO 4 2– PM 2.5 . In addition, crustal/soil/road dust and
traffic sources of PM have been found to be associated with increased respiratory symptoms in
asthmatic children and decreased PEF in asthmatic adults. Inconsistent results were observed in
those PM 2.5 studies that used individual constituents to examine associations with respiratory
morbidity and mortality, although Cu, Pb, OC, and Zn were related to respiratory health effects in
two or more studies.
A few studies have identified PM 2.5 sources associated with total mortality. These studies
found an association between mortality and the PM 2.5 sources: secondary SO 4 2–/long-range
transport, traffic, and salt. In addition, studies have evaluated whether the variation in associations
between PM 2.5 and mortality or PM 10 and mortality reflects differences in PM 2.5 constituents. PM 10 -
mortality effect estimates were greater in areas with a higher proportion of Ni in PM 2.5 , but the
overall PM 10 -mortality association was diminished when New York City was excluded in sensitivity
analyses in two of the studies. V was also found to modify PM 10 -mortality effect estimates. When
examining the effect of species-to-PM 2.5 mass proportion on PM 2.5 -mortality effect estimates, Ni,
but not V, was also found to modify the association.
Overall, the results indicate that many constituents of PM can be linked with differing health
effects and the evidence is not yet sufficient to allow differentiation of those constituents or sources
that are more closely related to specific health outcomes. These findings are consistent with the
conclusions of the 2004 PM AQCD (U.S. EPA, 2004, 056905) (i.e., that a number of source types,
including motor vehicle emissions, coal combustion, oil burning, and vegetative burning, are
associated with health effects). Although the crustal factor of fine particles was not associated with
mortality in the 2004 PM AQCD (U.S. EPA, 2004, 056905), recent studies have suggested that PM
(both PM 2.5 and PM 10-2.5 ) from crustal, soil or road dust sources or PM tracers linked to these sources
are associated with cardiovascular effects. In addition, PM 2.5 secondary SO 4 2– has been associated
with both cardiovascular and respiratory effects.
2.5. Welfare Effects
This section presents key conclusions and scientific judgments regarding causality for welfare
effects of PM as discussed in Chapter 9. The effects of particulate NO X and SO X have recently been
evaluated in the ISA for Oxides of Nitrogen and Sulfur – Ecological Criteria (U.S. EPA, 2008,
157074). That ISA focused on the effects from deposition of gas- and particle-phase pollutants
related to ambient NO X and SO X concentrations that can lead to acidification and nutrient
enrichment. Thus, emphasis in Chapter 9 is placed on the effects of airborne PM, including NO X and
SO X , on visibility and climate, and on the effects of deposition of PM constituents other than NO X
and SO X , primarily metals and carbonaceous compounds. EPA’s framework for causality, described
in Chapter 1, was applied and the causal determinations are highlighted.
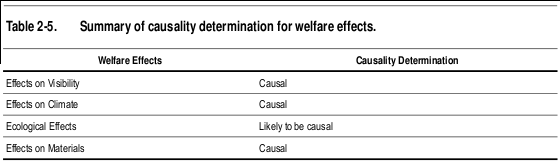
2.5.1. Summary of Effects on Visibility
Visibility impairment is caused by light scattering and absorption by suspended particles and
gases. There is strong and consistent evidence that PM is the overwhelming source of visibility
impairment in both urban and remote areas. EC and some crustal minerals are the only commonly
occurring airborne particle components that absorb light. All particles scatter light, and generally
light scattering by particles is the largest of the four light extinction components (i.e., absorption and
scattering by gases and particles). Although a larger particle scatters more light than a similarly
shaped smaller particle of the same composition, the light scattered per unit of mass is greatest for
particles with diameters from ~0.3-1.0 μm.
For studies where detailed data on particle composition by size are available, accurate
calculations of light extinction can be made. However, routinely available PM speciation data can be
used to make reasonable estimates of light extinction using relatively simple algorithms that multiply
the concentrations of each of the major PM species by its dry extinction efficiency and by a water
growth term that accounts for particle size change as a function of relative humidity for hygroscopic
species (e.g., sulfate, nitrate, and sea salt). This permits the visibility impairment associated with
each of the major PM components to be separately approximated from PM speciation monitoring
data.
Direct optical measurement of light extinction measured by transmissometer, or by combining
the PM light scattering measured by integrating nephelometers with the PM light absorption
measured by an aethalometer, offer a number of advantages compared to algorithm estimates of light
extinction based on PM composition and relative humidity data. The direct measurements are not
subject to the uncertainties associated with assumed scattering and absorption efficiencies used in the
PM algorithm approach. The direct measurements have higher time resolution (i.e., minutes to
hours), which is more commensurate with visibility effects compared with calculated light extinction
using routinely available PM speciation data (i.e., 24-h duration).
Particulate sulfate and nitrate have comparable light extinction efficiencies (haze impacts per
unit mass concentration) at any relative humidity value. Their light scattering per unit mass
concentration increases with increasing relative humidity, and at sufficiently high humidity values
(RH>85%) they are the most efficient particulate species contributing to haze. Particulate sulfate is
the dominant source of regional haze in the eastern U.S. (>50% of the particulate light extinction)
and an important contributor to haze elsewhere in the country (>20% of particulate light extinction).
Particulate nitrate is a minor component of remote-area regional haze in the non-California western
and eastern U.S., but an important contributor in much of California and in the upper Midwestern
U.S., especially during winter when it is the dominant contributor to particulate light extinction.
EC and OC have the highest dry extinction efficiencies of the major PM species and are
responsible for a large fraction of the haze, especially in the northwestern U.S., though absolute
concentrations are as high in the eastern U.S. Smoke plume impacts from large wildfires dominate
many of the worst haze periods in the western U.S. Carbonaceous PM is generally the largest
component of urban excess PM 2.5 (i.e., the difference between urban and regional background
concentration). Western urban areas have more than twice the average concentrations of
carbonaceous PM than remote areas sites in the same region. In eastern urban areas PM 2.5 is
dominated by about equal concentrations of carbonaceous and sulfate components, though the
usually high relative humidity in the East causes the hydrated sulfate particles to be responsible for
about twice as much of the urban haze as that caused by the carbonaceous PM.
PM 2.5 crustal material (referred to as fine soil) and PM 10-2.5 are significant contributors to haze
for remote areas sites in the arid southwestern U.S. where they contribute a quarter to a third of the
haze, with PM 10-2.5 usually contributing twice that of fine soil. Coarse mass concentrations are as
high in the Central Great Plains as in the deserts though there are no corresponding high
concentrations of fine soil as in the Southwest. Also the relative contribution to haze by the high
coarse mass in the Great Plains is much smaller because of the generally higher haze values caused
by the high concentrations of sulfate and nitrate PM in that region.
Visibility has direct significance to people’s enjoyment of daily activities and their overall
sense of wellbeing. For example, psychological research has demonstrated that people are
emotionally affected by poor VAQ such that their overall sense of wellbeing is diminished. Urban
visibility has been examined in two types of studies directly relevant to the NAAQS review process:
urban visibility preference studies and urban visibility valuation studies. Both types of studies are
designed to evaluate individuals’ desire for good VAQ where they live, using different metrics.
Urban visibility preference studies examine individuals’ preferences by investigating the amount of
visibility degradation considered unacceptable, while economic studies examine the value an
individual places on improving VAQ by eliciting how much the individual would be willing to pay
for different amounts of VAQ improvement.
There are three urban visibility preference studies and two additional pilot studies that have
been conducted to date that provide useful information on individuals’ preferences for good VAQ in
the urban setting. The completed studies were conducted in Denver, Colorado, two cities in British
Columbia, Canada, and Phoenix, AZ. The additional studies were conducted in Washington, DC. The
range of median preference values for an acceptable amount of visibility degradation from the 4
urban areas was approximately 19-33 dv. Measured in terms of visual range (VR), these median
acceptable values were between approximately 59 and 20 km.
The economic importance of urban visibility has been examined by a number of studies
designed to quantify the benefits (or willingness to pay) associated with potential improvements in
urban visibility. Urban visibility valuation research was described in the 2004 PM AQCD (U.S. EPA,
2004, 056905) and the 2005 PM Staff Paper (U.S. EPA, 2005, 090209). Since the mid-1990s, little
new information has become available regarding urban visibility valuation (Section 9.2.4).
Collectively, the evidence is sufficient to conclude that a causal relationship exists
between PM and visibility impairment.
2.5.2. Summary of Effects on Climate
Aerosols affect climate through direct and indirect effects. The direct effect is primarily
realized as planet brightening when seen from space because most aerosols scatter most of the
visible spectrum light that reaches them. The Intergovernmental Panel on Climate Change (IPCC)
Fourth Assessment Report (AR4) (IPCC, 2007, 092765), hereafter IPCC AR4, reported that the
radiative forcing from this direct effect was -0.5 (±0.4) W/m2 and identified the level of scientific
understanding of this effect as 'Medium-low'. The global mean direct radiative forcing effect from
individual components of aerosols was estimated for the first time in the IPCC AR4 where they were
reported to be (all in W/m2 units): -0.4 (±0.2) for sulfate, -0.05 (±0.05) for fossil fuel-derived organic
carbon, +0.2 (±0.15) for fossil fuel-derived black carbon (BC), +0.03 (±0.12) for biomass burning,
-0.1 (±0.1) for nitrates, and -0.1 (±0.2) for mineral dust. Global loadings of anthropogenic dust and
nitrates remain very troublesome to estimate, making the radiative forcing estimates for these
constituents particularly uncertain.
Numerical modeling of aerosol effects on climate has sustained remarkable progress since the
time of the 2004 PM AQCD (U.S. EPA, 2004, 056905), PM AQCD, though model solutions still
display large heterogeneity in their estimates of the direct radiative forcing effect from
anthropogenic aerosols. The clear-sky direct radiative forcing over ocean due to anthropogenic
aerosols is estimated from satellite instruments to be on the order of -1.1 (±0.37) W/m2 while model
estimates are -0.6 W/m2. The models' low bias over ocean is carried through for the global average:
global average direct radiative forcing from anthropogenic aerosols is estimated from measurements
to range from -0.9 to -1.9 W/m2, larger than the estimate of -0.8 W/m2 from the models.
Aerosol indirect effects on climate are primarily realized as an increase in cloud brightness
(termed the 'first indirect' or Twomey effect), changes in precipitation, and possible changes in cloud
lifetime. The IPCC AR4 reported that the radiative forcing from the Twomey effect was -0.7 (range:
-1.1 to +4) and identified the level of scientific understanding of this effect as “Low” in part owing
to the very large unknowns concerning aerosol size distributions and important interactions with
clouds. Other indirect effects from aerosols are not considered to be radiative forcing.
Taken together, direct and indirect effects from aerosols increase Earth's shortwave albedo or
reflectance thereby reducing the radiative flux reaching the surface from the Sun. This produces net
climate cooling from aerosols. The current scientific consensus reported by IPCC AR4 is that the
direct and indirect radiative forcing from anthropogenic aerosols computed at the top of the
atmosphere, on a global average, is about -1.3 (range: -2.2 to -0.5) W/m2. While the overall global
average effect of aerosols at the top of the atmosphere and at the surface is negative, absorption and
scattering by aerosols within the atmospheric column warms the atmosphere between the Earth's
surface and top of the atmosphere. In part, this is owing to differences in the distribution of aerosol
type and size within the vertical atmospheric column since aerosol type and size distributions
strongly affect the aerosol scattering and reradiation efficiencies at different altitudes and
atmospheric temperatures. And, although the magnitude of the overall negative radiative forcing at
the top of the atmosphere appears large in comparison to the analogous IPCC AR4 estimate of
positive radiative forcing from anthropogenic GHG of about +2.9 (± 0.3) W/m 2, the horizontal,
vertical, and temporal distributions and the physical lifetimes of these two very different radiative
forcing agents are not similar; therefore, the effects do not simply off-set one another.
Overall, the evidence is sufficient to conclude that a causal relationship exists between
PM and effects on climate, including both direct effects on radiative forcing and indirect
effects that involve cloud feedbacks that influence precipitation formation and cloud
lifetimes.
2.5.3. Summary of Ecological Effects of PM
Ecological effects of PM include direct effects to metabolic processes of plant foliage;
contribution to total metal loading resulting in alteration of soil biogeochemistry and microbiology,
plant growth and animal growth and reproduction; and contribution to total organics loading
resulting in bioaccumulation and biomagnification across trophic levels. These effects were well-
characterized in the 2004 PM AQCD (U.S. EPA, 2004, 056905). Thus, the summary below builds
upon the conclusions provided in that review.
PM deposition comprises a heterogeneous mixture of particles differing in origin, size, and
chemical composition. Exposure to a given concentration of PM may, depending on the mix of
deposited particles, lead to a variety of phytotoxic responses and ecosystem effects. Moreover, many
of the ecological effects of PM are due to the chemical constituents (e.g., metals, organics, and ions)
and their contribution to total loading within an ecosystem.
Investigations of the direct effects of PM deposition on foliage have suggested little or no
effects on foliar processes, unless deposition levels were higher than is typically found in the
ambient environment. However, consistent and coherent evidence of direct effects of PM has been
found in heavily polluted areas adjacent to industrial point sources such as limestone quarries,
cement kilns, and metal smelters (Sections 9.4.3 and 9.4.5.7). Where toxic responses have been
documented, they generally have been associated with the acidity, trace metal content, surfactant
properties, or salinity of the deposited materials.
An important characteristic of fine particles is their ability to affect the flux of solar radiation
passing through the atmosphere, which can be considered in both its direct and diffuse components.
Foliar interception by canopy elements occurs for both up- and down-welling radiation. Therefore,
the effect of atmospheric PM on atmospheric turbidity influences canopy processes both by radiation
attenuation and by changing the efficiency of radiation interception in the canopy through
conversion of direct to diffuse radiation. Crop yields can be sensitive to the amount of radiation
received, and crop losses have been attributed to increased regional haze in some areas of the world
such as China (Section 9.4.4). On the other hand, diffuse radiation is more uniformly distributed
throughout the canopy and may increase canopy photosynthetic productivity by distributing radiation
to lower leaves. The enrichment in photosynthetically active radiation (PAR) present in diffuse
radiation may offset a portion of the effect of an increased atmospheric albedo due to atmospheric
particles. Further research is needed to determine the effects of PM alteration of radiative flux on the
growth of vegetation in the U.S.
The deposition of PM onto vegetation and soil, depending on its chemical composition, can
produce responses within an ecosystem. The ecosystem response to pollutant deposition is a direct
function of the level of sensitivity of the ecosystem and its ability to ameliorate resulting change.
Many of the most important ecosystem effects of PM deposition occur in the soil. Upon entering the
soil environment, PM pollutants can alter ecological processes of energy flow and nutrient cycling,
inhibit nutrient uptake, change ecosystem structure, and affect ecosystem biodiversity. The soil
environment is one of the most dynamic sites of biological interaction in nature. It is inhabited by
microbial communities of bacteria, fungi, and actinomycetes, in addition to plant roots and soil
macro-fauna. These organisms are essential participants in the nutrient cycles that make elements
available for plant uptake. Changes in the soil environment can be important in determining plant
and ultimately ecosystem response to PM inputs.
There is strong and consistent evidence from field and laboratory experiments that metal
components of PM alter numerous aspects of ecosystem structure and function. Changes in the soil
chemistry, microbial communities and nutrient cycling, can result from the deposition of trace
metals. Exposures to trace metals are highly variable, depending on whether deposition is by wet or
dry processes. Although metals can cause phytotoxicity at high concentrations, few heavy metals
(e.g., Cu, Ni, Zn) have been documented to cause direct phytotoxicity under field conditions.
Exposure to coarse particles and elements such as Fe and Mg are more likely to occur via dry
deposition, while fine particles, which are more often deposited by wet deposition, are more likely to
contain elements such as Ca, Cr, Pb, Ni, and V. Ecosystems immediately downwind of major
emissions sources can receive locally heavy deposition inputs. Phytochelatins produced by plants as
a response to sublethal concentrations of heavy metals are indicators of metal stress to plants.
Increased concentrations of phytochelatins across regions and at greater elevation have been
associated with increased amounts of forest injury in the northeastern U.S.
Overall, the ecological evidence is sufficient to conclude that a causal relationship is likely
to exist between deposition of PM and a variety of effects on individual organisms and
ecosystems, based on information from the previous review and limited new findings in
this review. However, in many cases, it is difficult to characterize the nature and magnitude of
effects and to quantify relationships between ambient concentrations of PM and ecosystem response
due to significant data gaps and uncertainties as well as considerable variability that exists in the
components of PM and their various ecological effects.
2.5.4. Summary of Effects on Materials
Building materials (metals, stones, cements, and paints) undergo natural weathering processes
from exposure to environmental elements (wind, moisture, temperature fluctuations, sunlight, etc.).
Metals form a protective film of oxidized metal (e.g., rust) that slows environmentally induced
corrosion. However, the natural process of metal corrosion is enhanced by exposure to
anthropogenic pollutants. For example, formation of hygroscopic salts increases the duration of
surface wetness and enhances corrosion.
A significant detrimental effect of particle pollution is the soiling of painted surfaces and other
building materials. Soiling changes the reflectance of opaque materials and reduces the transmission
of light through transparent materials. Soiling is a degradation process that requires remediation by
cleaning or washing, and, depending on the soiled surface, repainting. Particulate deposition can
result in increased cleaning frequency of the exposed surface and may reduce the usefulness of the
soiled material.
Attempts have been made to quantify the pollutant exposure levels at which materials damage
and soiling have been perceived. However, to date, insufficient data are available to advance the
knowledge regarding perception thresholds with respect to pollutant concentration, particle size, and
chemical composition. Nevertheless, the evidence is sufficient to conclude that a causal
relationship exists between PM and effects on materials.
2.6. Summary of Health Effects and Welfare Effects
Causal Determinations
This chapter has provided an overview of the underlying evidence used in making the causal determinations for the health and welfare effects and PM size fractions evaluated. This review builds upon the main conclusions of the last PM AQCD (U.S. EPA, 2004, 056905):
- "A growing body of evidence both from epidemiological and toxicological studies supports the general conclusion that PM 2.5 (or one or more PM 2.5 components), acting alone and/or in
- “A much more limited body of evidence is suggestive of associations between short-term (but not long-term) exposures to ambient coarse-fraction thoracic particles and various mortality and morbidity effects observed at times in some locations. This suggests that PM 10-2.5 , or some constituent component(s) of PM 10-2.5 , may contribute under some circumstances to increased human health risks with somewhat stronger evidence for associations with morbidity (especially respiratory) endpoints than for mortality.” (pg 9-79 and 9-80)
- "Impairment of visibility in rural and urban areas is directly related to ambient concentrations of fine particles, as modulated by particle composition, size, and hygroscopic characteristics, and by relative humidity.” (pg 9-99)
- “Available evidence, ranging from satellite to in situ measurements of aerosol effects on incoming solar radiation and cloud properties, is strongly indicative of an important role in climate for aerosols, but this role is still poorly quantified.” (pg 9-111)
The evaluation of the epidemiologic, toxicological, and controlled human exposure studies published since the completion of the 2004 PM AQCD have provided additional evidence for PM-related health effects. Table 2-6 provides an overview of the causal determinations for all PM size fractions and health effects. Causal determinations for PM and welfare effects, including visibility, climate, ecological effects, and materials are included in Table 2-7. Detailed discussions of the scientific evidence and rationale for these causal determinations are provided in the subsequent chapters of this ISA.
|


it could be completely unrelated
but I have had serious respiratory distress for 10 days.
everyone keeps saying it must be allergies.... but I do over look our lovely considerate pollution valley.
Yesterday (Sunday) the Air Products factory was making the worst loudest nasty noise I'd ever heard from them (in 10 years of listening to their crap). of course it wAS a Sunday....
If you read the report you know Cleveland is killing you.
If you read the report you know Cleveland is killing you.
I noticed the monitor data has been way down since Sunday (although at least one downtown monitor seems to always be out of service) - the weather has much to do with pollution being washed and blown from your window so the last two days should have been better. Also, when I drove by Mittal today it seems like they have cut back on the polluting - keep an eye on their stacks...
I don;t know of any specific dangerous emissions from Air Products but I am checking into all the pollution inventory reports and all the monitors... even the PM 10 monitors they say we don't need any more... we'll soon know more about the air we are breathing.
Disrupt IT
well...
we're moving, so god bless the next poor souls who more to the glorious Tremont....
Smart - we are too... from University Circle
Smart - we are too... from University Circle... as we save 1,000,000s of other lives.
Power to realNEO!
Disrupt IT
And I blame Frank...
And I blame Frank...
How long has he been in charge of this disgrace????
Disrupt IT
Action Jackson?
he's not in charge.... he couldn't run a quicky mart...
He is in charge of our local environmental policy, and it sucks
He is in charge of our local environmental policy, and it sucks. Trust me.
Disrupt IT