Submitted by Norm Roulet on Tue, 03/08/2011 - 12:34.
I just received an email from the EPA announcing it "updated its database that helps Americans understand the health and environmental impacts of electricity generation" and now provides a useful public interface - "Power Profiler is a user friendly online application that uses eGRID data to show air emissions information and the type of electricity generation, such as coal or nuclear, in various regions of the country. By simply entering a zip code and selecting a utility, users can learn more about where their electricity comes from and what impact it has on air quality and the environment."
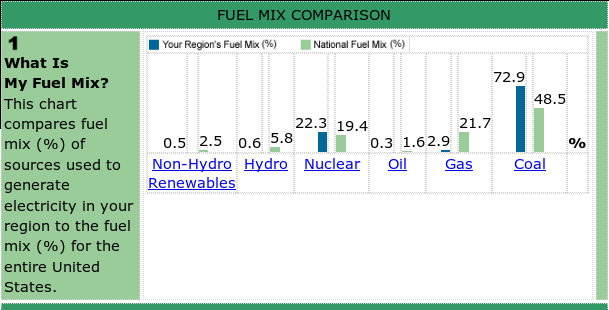
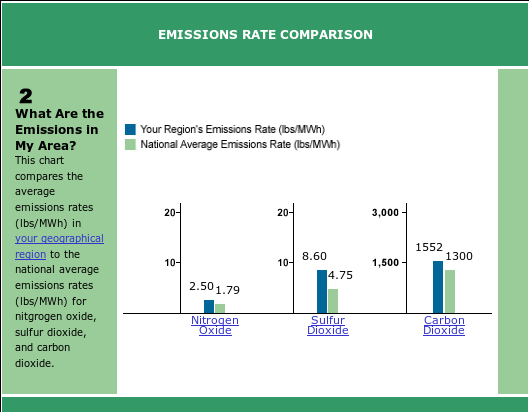
I entered my zip code in the Cleveland area - 44115 - and have posted the results below this EPA press release - these results are for Cleveland Public Power (chart below and above as well). Our fuel mix has more coal, and our energy emissions have more pollution, than the national average, which is not what any people on Earth want where they live, work or play.
It seems logical to me that, in the future, the first place international students and investors - and entrepreneurs, recent graduates and CEOs of companies looking to expand - will look for insight on choosing their home will be databases of community health and sustainability like eGRID Power Profiler - and what that says about my zip code is do not move there.
EPA Updates Database on Health and Environmental Impacts of Electricity Generation
User friendly web tool allows Americans to search for power providers by zip code
WASHINGTON -- The U.S. Environmental Protection Agency updated its database that helps Americans understand the health and environmental impacts of electricity generation. EPA’s Emissions and Generation Integrated Resource Database (eGRID) and Power Profiler now include data from 2007, an update from 2005.
eGRID is a comprehensive database of emissions from almost all electric power generated in the United States. The data are widely used to show the impacts of electricity generation as well as the benefits from reduced electricity demand. eGRID contains emissions information for nitrogen oxides (NOx) and sulfur dioxide (SO2) which contribute to unhealthy air quality and acid rain in many parts of the country. eGRID also contains emissions information for carbon dioxide (CO2), methane (CH4), and nitrous oxide (N2O), which are greenhouse gases that contribute to climate change.
Power Profiler is a user friendly online application that uses eGRID data to show air emissions information and the type of electricity generation, such as coal or nuclear, in various regions of the country. By simply entering a zip code and selecting a utility, users can learn more about where their electricity comes from and what impact it has on air quality and the environment.
More information about eGRID:
http://www.epa.gov/egrid
More information about Power Profiler:
http://www.epa.gov/powerprofiler
How Does the Electricity I Use Compare to the National Average?<!-- InstanceEndEditable -->
The table below contains two charts:
- The first chart compares the fuel mix used to generate electricity in your region of the power grid to the national fuel mix.
- The second chart compares the average air emissions rates in your region of the power grid to the national average emissions rates.
- Note: The information reported below is derived from EPA's eGRID database for calendar year 2007.
- eGRID Subregion: RFC West (which includes the ZIP code: 44115)

What Air Emissions Are Caused by the Electricity I Use?
To find your emissions, you can choose one of the three options:
- Option 1: You can collect a year's worth of utility bills and enter information about your utility use, measured in kilowatt hours (kWh), for each month of the year. (This option provides the most precise answer.)
- Option 2: You can estimate your average monthly utility use for the year.
- Option 3: You can use the default values provided for average residential or commercial utility use.
How You Can Make a Difference

