The entire "A USDA Regional Roadmap to Meeting the Biofuels Goals of the Renewable Fuels Standard by 2022 - USDA Biofuels Strategic Production Report" is included and attached below:
A USDA Regional Roadmap to Meeting the Biofuels Goals of the Renewable Fuels Standard by 2022
USDA Biofuels Strategic Production Report - June 23, 2010
I. INTRODUCTION
The U.S. Department of Agriculture (USDA) is developing a comprehensive regional strategy to
help recharge the rural American economy. The strategy targets barriers to the development of a
successful biofuels market that will achieve, or surpass, the current U.S. Renewable Fuels
Standards (RFS2), as set out in the Energy Independence and Security Act of 2007 (EISA). The
RFS2, implementation provisions of which are detailed in the Environmental Protection
Agency’s RFS2 Final Rule (March 26, 2010 Federal Register), becomes effective on July 1,
2010. The RFS2 will create new market opportunities for American agriculture to help fulfill its
mandate: the American economy will be using 36 billion gallons (bg) of renewable
transportation fuel per year in its transportation fuel supply by 2022.
USDA is uniquely positioned, given its detailed knowledge of the agriculture sector, to
understand and support the goals of RFS2 at an agricultural regional level. When President
Obama established a Biofuels Interagency Working Group (BIWG) it was intended to coordinate
the federal government’s efforts on the nation’s first comprehensive biofuel market development
program. The BIWG is using existing authorities and new policies to support the development
of next-generation biofuels, increase flexible fuel vehicle use, and assist in retail marketing
efforts. The Working Group is co-chaired by the Secretaries of Agriculture and Energy and the
Administrator of the Environmental Protection Agency. The BIWG brings together and engages
in inter-agency policy discussions on the growing biofuels industry.
As part of that larger conversation, USDA’s objectives for this report include: providing the
practical knowledge from the field that can enhance various models for biofuel production,
identify challenges and opportunities, and help develop solutions to this massive undertaking. In
addition, USDA hopes that this report spurs discussions and is looking forward to feedback from
Congress, states, industry, science, and all concerned citizens and stakeholders.
This report is the work of multiple agencies at USDA, including Rural Development, the Natural
Resources Conservation Service, the Forest Service, and the Farm Services Agency, as well as
the Office of the Chief Economist and its Office Energy Policy and New Uses, among others, to
assess: existing eligible feedstock supply and land availability, current and potential
infrastructure capacity, and current and potential regional consumer demand. The report relies on
the work of other agencies as inputs, though the analytical approach was developed by USDA.
This is an interim product subject to revision given more inputs, including the work of the
Biofuels Interagency Working Group.
Over the last 60 years, the percentage of the U.S. population directly involved in production
agriculture in America has gone from 15 percent to less than two percent, but the average farmer
produces food for 155 people today, as compared to his counterpart 60 years ago who produced
food for only 25 people. This increase in efficiency in agriculture and farming, and the resulting
sharp decrease in the number of hands needed to meet a growing demand, by its very nature,
requires that the rural economy diversify. Growing a domestic biofuels market is part of overall
USDA rural strategy to help rebuild rural America.
II. WE ARE ALREADY ON OUR WAY: The Role of Corn Starch Ethanol
The Congressionally mandated RFS2 goal is to use at least 36 billion gallons of bio-based
transportation fuels by 2022 that reduce greenhouse gas emissions by the percentages specified
under the RFS2. Fifteen billion gallons can come from conventional biofuel sources such as
corn ethanol. EPA’s analysis projects that 15 billion gallons of conventional biofuels could
come from current or planned production capacity of corn starch ethanol by 2022.
In 2009, the United States produced 10.75 billion gallons of ethanol, primarily as corn starch
ethanol. The expectation for 2010 is for the United States will produce approximately 12.0
billion gallons of ethanol. According to the Renewable Fuel Association (RFA), there are
currently 201 ethanol facilities with a capacity to produce 13.5 billion gallons (RFA, April 27,
2010). In addition, there are facilities currently under construction that will add another 1.2 bg
of capacity of corn starch ethanol. As a result, the United States will soon have the installed
capacity to produce up to the 15.0 billion gallons of corn-starch ethanol that is allowed by RFS2.
This means that we are already well on our way to meeting the 36 billion gallon goal. See
Appendix A for a state by state breakdown of the current state of ethanol production in the
United States.
III. MEETING THE 21 BILLION GALLON ADVANCED BIOFUELS CHALLENGE
Of the remaining 21 billion gallons of advanced biofuels needed to achieve the total 36 billion
gallon goal, 16 billion gallons is required to come from advanced cellulosic biofuels (fuels made
from cellulosic feedstocks that also reduce greenhouse gas emissions by at least 60 percent
relative to gasoline). The contribution of biomass-based diesel to the 21 billion gallons goal can
be no less than 1 billion gallons and will be determined at a later date by rulemaking. An
additional 4 billion gallons of advanced biofuels (defined by the reduction of greenhouse gas
emissions by at least 50 percent) by 2022 is also mandated by EISA.
Biodiesel One Billion.
The U.S biofuels industry is on track to produce 1 billion gallons of
biodiesel by 2022. In 2009, the United States already produced 550 million gallons of biodiesel.
There are presently 173 plants and nearly as many companies that have invested millions of dollars into
the development of biodiesel manufacturing plants and are actively marketing biodiesel. Twenty-nine
companies have reported that they have plants currently under construction and are scheduled to
be completed within the next 12-18 months. Their combined capacity, if realized, would result in
another 427.8 million gallons per year of biodiesel production.
The remaining 20-bg challenge: cellulosic and other advanced biofuels. USDA is working
to establish a sustainable biofuels economy to help meet the 20-billion gallons of advanced
biofuels challenge. The intention is to develop strategic partnerships with the private sector. By
so doing, we expect to expedite the development and deployment of research, development and
demonstration projects, facilitate the siting of biorefineries through loan guarantees and other
existing programs, and identify potential barriers to meeting transportation and distribution needs
for an advanced biofuels industry. The analysis presented below presents one scenario by which
the RFS targets could be met. It is based on a USDA analysis of regional feedstock availability
and other factors. This analysis is based on converting agricultural and forestry feedstocks to
ethanol; however, these feedstocks could be converted to other potential fuels such as methanol
biobutanol, green gasoline, and jet fuel (i.e. JP-8.)
(A) Feedstock Assumptions and Limitations
USDA has developed feedstock production scenarios based on dedicated crop feedstocks and
waste wood biomass that come from timberland and agricultural lands that are a subset of the
RFS2 definitions and assumptions. What is encouraging is that USDA considers these estimates
as conservative, because the estimates do not include all possible feedstock sources that may
eventually be eligible to achieve the 21 billion gallons of advanced biofuels as specified by
RFS2. This is good news since qualified feedstocks identified by EPA but not included in the
current USDA analysis (e.g., tallow, municipal solid waste) could be counted toward meeting the
RFS2 mandate. In addition, if technologies are developed in a timely manner to use an even
wider variety of feedstocks, increase conversion ratios, or utilize waste or co-products
technologies, while meeting greenhouse gas emission reduction targets, then the total volume of
biofuels from approved feedstocks produced that meet emissions specified may exceed the 36
billion gallon RFS2 targets.
Feedstock Choice.In the RFS2 Final Rule, the EPA identifies a number of feedstock pathways
and imports that would satisfy the RFS2 mandates. Feedstock pathways for advanced biofuels
include switchgrass, soybean oil, corn oil, crop residues, woody biomass and other feedstocks.
The complement of feedstocks included in this USDA analysis and those identified by the EPA
should not be considered an exhaustive list of all possible feedstock sources. The petition
process exists to embrace the possibilities of technological advances and research evolution. In
order to be successful in the implementation of a domestic biofuels industry this flexibility
should be utilized in considering all the feedstock resources that America has to offer that meet
the greenhouse gas requirements and other restrictions of the RFS2.
USDA scientists, intramural and extra-mural research, and collaborative work with other Federal
agencies (i.e. Navy, Air Force) suggest that additional feedstocks such as biomass (sweet)
sorghum, energy cane, and camelina may merit consideration under the RFS2. For the purposes
of this analysis, USDA assumed that these feedstocks were sufficiently similar to those already
eligible under the Renewable Fuels Standard and necessary to the regional approach. USDA
recognizes that a formal review by the EPA of each of the feedstocks would be required to
evaluate whether they qualify as an advanced biofuel.
Feedstock Definitions.
EISA includes specific greenhouse gas reduction thresholds levels for
renewable fuel mandates that feedstock pathways must meet. The EPA in its analysis of the
feedstock pathways was required to carry out a complete greenhouse gases life-cycle-analysis,
which considers reductions in carbon emissions and other greenhouse gas. In addition, EISA
provides a specific definition of renewable biomass and places constraints on the types of land
from which renewable biomass can be collected or harvested. For the sake of consistency USDA
chose to use those definitions in the context of this report.
Feedstock Assumption Summary
EPA expects the following feedstocks and the associated number of gallons by 2022:
Switchgrass (perennial grass): 7.9 bg
Soy biodiesel and corn oil: 1.34 bg
Crop residues (corn stover, includes bagasse): 5.5 bg
Woody biomass (forestry residue): 0.1 bg
(data does not include short-term woody crops)
Corn ethanol: 15.0 bg
Other (municipal solid waste (MSW)): 2.6 bg
Animal fats and yellow grease: 0.38 bg
Algae: 0.1 bg
Imports: 2.2 bg
USDA estimates the following feedstocks and the associated gallons by 2022: (this count
does not include tallow, MSW, or algae)
Dedicated energy crops:
perennial grasses, energy cane, biomass sorghum: 13.4 bg
Oilseeds (soy, canola): 0.5 bg
Crop residues (corn stover, straw): 4.3 bg
Woody biomass (logging residues only): 2.8 bg
Corn starch ethanol: 15.0 bg
1Biofuels that have a higher energy density than ethanol receive a greater weighting as it contributes to the RFS2
mandate total. For example, each gallon of biodiesel counts as 1.5 gallons of renewable toward the mandate. On
a volume basis, the total for those feedstock pathways will sum to less than 36 bg.
2 These calculations are based on research by Agricultural Research Service scientists who calculated energy yield
by feedstock. In addition, the feedstocks used for this report are those USDA posits are most likely to be produced
in volume.
3 This calculation is based on the sum of the energy yields per acre of the analyzed feedstocks.
(B) Land Use Assumptions and Limitations
Consistent with EISA, USDA assumes that biomass may be grown on defined agriculture
cropland (agriculture cropland where crops are produced and agriculture cropland in pasture). To
produce this much in biofuels will take 27 million acres of cropland,3 6.5 percent of the total
406.4 million acres of cropland as reported in the 2007 Census of Agriculture (COA). This does
not include acreage of timberland harvested from which logging residues are viable feedstocks,
nor does it include acreage from traditional food crops from which post harvest crop residues are
collected. Importantly, USDA will assess the acreage of fallow and underutilized lands that can
be sustainably converted into dedicated energy crops.
Cropland.
The UDSA’s 2007 COA reports that there is a total of 922.1 million acres of Land in
Farms. The category land in farms is comprehensive and represents all land in farms: land that is
defined as agriculture cropland (406.4 million acres) and other land (515.7 million acres).
Cropland is further segmented into the following categories: cropland harvested, cropland used
as pasture (land that could be planted, but is in pasture the year of the COA), other crop land that
is idled for conservation or intentional purposes, summer fallow, and failed crops. Cropland
harvested is the larger category accounting for 76 percent of the total cropland.
Land in Farms (1,000 Acres) 2007
Total land in farm 922,095
Total cropland 406,424
Cropland harvested 309,607
Other land 515,671
Cropland in Agriculture (1,000 Acres) 2007
Cropland harvested 309,607
Cropland used for pasture 35,771
Cropland cover crop not harvested pasture 37,969
Summer fallow 15,671
Cropland on which all crops faile 7,405
Cropland idle 0
Total 406,423
EISA provides a definition of renewable biomass that is more restrictive than the Farm Bill
definition of renewable biomass. EISA restricts where feedstocks can grow and be harvested for
use in producing renewable fuels for compliance with the RFS2. For planted crops/crop residue
from agricultural land and planted trees/tree residue from actively managed tree plantations on
non-federal land, feedstocks must come from land cleared/cultivated land prior to December 19,
2007. EPA’s approach excludes rangeland as an approved land type from which renewable
biomass could be produced or harvested.
Forested land.
USDA estimates of biomass from logging residues are based on actual data from
the 2001 – 2005 period. The average annual volume of logging residues (all species), average
over the 2001-2005 period, is assumed available per annum. The total and harvested timberland
area is also averaged over 2000-2005 period to give an estimate of the area that logging residues
actually come from and, potentially, how large or how much biomass might be available. For
the purposes of this analysis 42.5 million dry tons of logging residues, used for no other purpose
and totaling only a percentage of the total logging residues actually generated by logging
practices, is available for fuel production annually. This residue is taken from 10.8 million acres
of harvested acreage, as compared to the 507.3 million acres of timberland available for
harvesting activities. One dry ton of logging residues is assumed to yield 70 gallons of ethanol
per dry ton. In total, about 2.8 billion gallons of advanced biofuels is projected from logging
residues when the conversion technology is commercialized.
(C) USDA Regional Analysis Assumption Summary
USDA recognized that different regions of the country have a comparative advantage to the type
of feedstocks that can be produced and utilized in biofuel production. By leveraging the
availability of these regional resources, diversification of biofuel production will be a national
solution to reducing the Nation’s dependence on oil, much of which is imported.
These regions were determined based upon the prevalence of potential crop and woody biomass
feedstocks adapted to different ecological regions of the county, their yields, and current
producer interest. USDA estimated 4 the following regional biofuel contributions to the RFS2
advanced biofuel goal of at least 21 billion gallons a year by 2022:
Southeast: 49.8%
Northeast : 2.0%
Central-Eastern: 43.3%
Northwest: 4.6%
Western: < 0.3%,
assumed 0 for crop biomass, though there is opportunity for algae and woody biomass
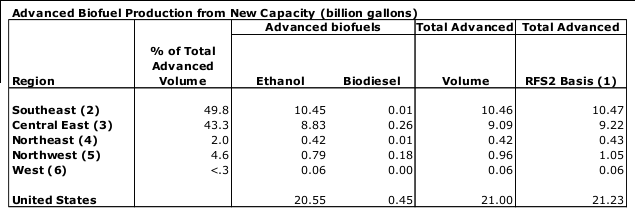
(1) RFS2 basis - higher density fuels receive higher weighting relative to ethanol. Biodiesel weight is 1.5
(2) Feedstocks: Perennial grasses, soyoil, energy cane, biomass (sweet) sorghum, logging residues
(3) Feedstocks: Perennial grasses, canola, soyoil, biomass (sweet) sorghum, corn stover, logging residues
(4) Feedstocks: Perennial grasses, soyoil, biomass (sweet) sorghum, corn stover, logging residues
(5) Feedstocks: C anola,straw, logging residues
(6) Feedstocks: Biomass (sweet) sorghum, logging residues
4 These estimates are based on energy yield per acre per feedstock, and estimates of acreage planted to those
feedstocks as regionally appropriate.
IV. OVERCOMING INFRASTRUCTURE BARRIERS TO CONVERTING BIOMASS INTO BIOFUELS
(A) Introduction.
This section of the report lays out the availability and regional distribution of the resources
needed to produce the biofuels to reach the RFS2 target of 36 bg of renewable biofuels per year.
In addition, it presents a path to the regional diversification of advanced biofuels, benefiting
multiple local communities across the country. This information should assist the government in
pinpointing potential barriers and bottlenecks to investment and assist the industry in developing
commercially viable enterprises that will benefit both the rural economy and U.S. consumers.
Assuming an average biorefinery size of 40 million gallons per year, USDA estimates it meeting
the RFS2 advanced biofuels goals will mean building of 527 biorefineries, at a cost of $168
billion.5 While we expect the market to react to this need, biorefineries will need to be
constructed in a timely manner, while accounting for transportation needs for feedstocks and fuel
distribution.
(B) Regional Status and Outlook on Advanced Biofuels Production
Review of Assumptions.
Costs.
USDA assumed a steady cellulosic plant construction cost of $8 per gallon.
We recognize that initial construction costs for first of a kind plant will typically be
greater than the costs of plants that follow; however, we assume a fixed capital cost
over time. Plant construction costs decline in real terms for this analysis.
Size.
This approach assumes each biorefinery built will have a capacity of 40 million
gallons a year.
Biofuel Regions.
Based on work by the Agricultural Research Service, biofuel
feedstock regions were developed based on crops that we expect will be prevalent in
those areas based on historic planting data and weather, soil and water conditions.
Energy Yields per Acre.
Through ARS research, we could assume certain energy
yields per acre by feedstock and thereby estimate the number of biorefineries
necessary for each region to fill their expected biofuels goals.
Technology Changes.
For the sake of this report, we assume no technology change,
which make our estimates conservative. This is a very conservative assumption as
RFS2 is predicated on challenging the industry to create newer, cleaner fuels. Also,
the agricultural sector as a whole is incredibly productive and has consistently
outpaced productivity increases in other sectors, in part, due to its investment in
technology (e.g. drought resistant seeds).
5 This figure comes from the analysis of USDA received applications for funding biorefineries that average the cost
of building the biorefinery divided by the projected plant capacity.
1. SOUTHEAST REGION and HAWAII:
States. Alabama, Arkansas, Florida, Georgia, Hawaii, Kentucky, Louisiana, Mississippi, North
Carolina, South Carolina, Tennessee, Texas
Feedstocks. Soybean oil, Energy cane, Biomass Sorghum, Perennial grasses, Woody biomass
Other Points of Interest. Hawaii, Florida, Georgia and Texas are the largest consumers of
petroleum in the region. USDA has an MOU to provide biofuels to the Navy in Hawaii that
involves research and development as well as implementation. With the Western Naval fleet in
HI, there is already a consumption base from the Navy of 80 million gallons of fuel a year.
Current Production Capacity.
Ethanol Biorefineries: Total facilities 20—17 producing, 2 idle, and one in construction
GA—2 producing; 1 in construction
KY—3 producing
LA—1 producing
MS—1 producing
NC—5 producing; 2 idle
TN—2 producing
TX—3 producing
Biodiesel Refineries: Total facilities 67—40 producing; 25 idle; 1 unknown status; 1 in
construction
AL—3 producing; 3 idle
AR—2 producing
FL—1 producing; 2 idle; 1 unknown status
GA—6 producing; 1 idle
HI—1 producing; 1 idle
KY—3 producing; 1 idle
LA—0 producing; 1 idle
MS—5 producing
NC—1 in construction
SC—3 producing
TN—3 producing; 3 idle
TX—13 producing; 10 idle
Potential Production Capacity.
This region could produce 10.5 billion gallons of advanced
biofuels per year, at 263 biorefineries producing 40 million gallons by year, costing $320 million
per biorefinery. This will take an $83.8 billion cumulative investment, to build the 263
biorefineries with an average capacity of 40 million gallons. USDA estimated that a significant
amount of volume, up to 50%, of the advanced biofuels, could come from this region because it
has the most robust growing season in the United States that supports the highest gallons-per-
acre crops of all biofuels crops. One advanced fuel biorefinery is expected to open in August of
2010 in Louisiana, with expected production of 75 million gallons.
Land Use.
In this region there is an acreage base of 83.4 million acres of cropland and cropland
pasture and 182.8 million acres of forest land. To produce the biofuels necessary from this
region, an advanced biofuel production of 10.5 billion gallons from 9.5 million acres, 11.4% of
the available cropland and cropland pasture acreage base, would be required for fuel use.
2. NORTHEAST REGION
States. Connecticut, Massachusetts, Maine, Michigan, New Hampshire, New Jersey, New York,
Rhode Island, Vermont, West Virginia
Feedstock. Woody biomass, municipal waste potential
Other Points of Interest. In addition to woody biomass there is corn in NY, and other row
crops in Southern PA which we have not taken into account yet. Other sources and affects yet to
be considered are municipal solid waste availability and existing infrastructure, brownfields, that
may be suitable sites for biorefineries.
Current Production Capacity.
Ethanol Biorefineries: Total 7 facilities producing
MI—5 producing
NY—2 producing
Biodiesel Refineries: Total 20 potential facilities—9 producing, 2 in construction; 5 with
unknown production status; 4 idle
CT—1 unknown status
MA—1 unknown status
ME—2 producing
MI—2 producing
NH—1 in construction; 1 unknown status
NJ—2 producing; 1 unknown status;
NY—3 producing; 1 in construction; 1 idle
RI—1 producing; 1 unknown status
WV—1 producing
Potential Production Capacity.
USDA estimates that 2.0% of advanced biofuel production
(mostly woody biomass) will come from the Northeast. The region could produce 423.7 million
gallons of advanced biofuels from 639,150 acres of dedicated bioenergy crops (perennial
grasses) plus 1.7 million acres of harvested logging residue in a year. This will take 11
biorefineries, producing 40 million gallons by year, costing $320 million per biorefinery, for a
total cost of $3.52 billion cumulative investment over time.
Land Use.
In the Northeast there is an acreage base of 15.1 million acres of cropland and
cropland pasture and 79.3 million acres of timber land. Approximately 4.5% of the available
cropland and cropland pasture acreage base is used in meeting the advanced biofuel mandates.
3. CENTRAL EAST REGION
States. Delaware, Iowa, Illinois, Indiana, Kansas, Missouri, Ohio, Oklahoma, Maryland,
Minnesota, Nebraska, North Dakota, Pennsylvania, South Dakota, Wisconsin, Virginia.
Feedstock.
Perennial grasses, biomass sorghum, crop residues, soy beans, woody biomass.
Other Points of Interest.
The Central East Region of the United States is one of two regions
with the most potential for near and long term development of biofuels. Based on feedstock and
land, infrastructure, and demand this region is key in implementing a successful biofuels market.
The current cap in the RFS2 as a result of EISA is 15 billion gallons of corn-starch ethanol. This
region will produce the last 4.25 billion gallons to reach the cap.
Current Production Capacity.
12 billion gallons per year conventional ethanol, .5 billion
gallons per year of biodiesel
Ethanol Biorefineries: Total facilities 171—170 facilities producing, one in construction
IA—40 producing
IL—13 producing
IN—11 producing
KS—12 producing; 1 in construction
MN—27 producing
MO—5 producing
ND—6 producing
NE—22 producing
OH—8 producing
PA—1 producing
SD—15 producing
VA—1 producing
WI—9 producing
Biodiesel Facilities: Total facilities 84 facilities—5 unknown, 14 idle, 63 producing; 2 in
construction
DE—1 idle
IA—8 producing; 6 idle
IL—4 producing; 3 idle; 1 in construction
IN—6 producing; 1 in construction, 1 unknown status
KS—1 producing
MD—5 producing; 1 unknown status
MN—3 producing; 2 unknown status
MO—11 producing
OH—8 producing; 3 idle
OK—2 producing; 1 idle
PA—7 producing
SD—1 producing
VA—3 producing
WI—3 producing; 1 unknown status
Potential Production Capacity.
USDA estimates that on a volume basis, 43.3% of the 20
billion gallons of advanced biofuel by 2022 will be produced in the Central East region. This
will take $72 billion in cumulative investments to build 226 biorefineries with an estimated
capacity of 40 million gallons per year.
Land Use.
This region has an acreage base of 241 million of cropland and cropland pasture plus
109.8 million acres of timber land that could produce 9.1 billion gallons from 10.8 million acres
of dedicated bioenergy crops plus 2.0 million acres of harvested logging residue in a year
Incremental advanced biofuel production will take up 4.5% of the available cropland and
cropland pasture acreage base.
4. NORTHWEST REGION
States. Alaska, Idaho, Montana, Oregon, Washington
Feedstock. Woody biomass, oil seed, grasses, cereal crop residue.
Other Points of Interest.
We have 100 million gallons a year currently being produced in this
region from canola, but much of the feedstock is imported from Canada and at this time canola is
not an approved feedstock pathway under the RFS2.
Current Production Capacity.
Ethanol Biorefineries: Total 4 facilities producing
ID—2 producing
WA—2 producing
Biodiesel Facilities: Total 10 facilities—7 producing, 1 idle, 2 in construction
ID—2 producing; 1 in construction
OR—1 producing
WA—4 producing; 1 idle; 1 in construction
Potential Production Capacity.
USDA estimates that 4.6% of advanced biofuel production of
the 21 billion gallons required by 2022 (primarily oilseed crops) will be from the Northwest
region. This will take an $8.32 billion investment to build 27 biorefineries with an average
capacity of 40 million gallons per year.
Land Use.
Acreage base of 36.9 million acres of cropland and cropland pasture plus 86.4 million
acres of forest land. To produce the 1 billion gallons from 2.5 million acres of dedicated
bioenergy crops plus 911,500 acres of harvested logging residue in a year it will take 6.9% of the
available cropland and cropland pasture acreage base.
5. WESTERN REGION
States. Arizona, California, Colorado, New Mexico, Nevada, Utah, Wyoming
Feedstock. Woody biomass, Oilseed crops (e.g. camelina, canola); potential for algae not
included.
Other Points of Interest.
While this region has potential for development of biofuels, it is very
limited and the total contribution to meeting the RFS2 requirement is less than 1%. That said,
USDA has already funded one commercial scale algae based biorefinery in New Mexico and
expects to see more efforts on algae based biofuels in California, among other places. As this
technology develops for algae, the US will have another feedstock resource contributing to
RFS2.
Current Production Capacity.
Ethanol Biorefineries: Total 15 facilities—13 producing, 2 in construction
AZ—1 producing
CA—6 producing; 1 in construction
CO—4 producing; 1 in construction
NV—1 producing
WY—1 producing
Biodiesel Facilities: Total 27 facilities—18 producing, 5 idle, 3 in construction, 1
unknown
AZ—3 producing
CA—13 producing; 3 idle; 2 in construction
CO—2 producing; 1 idle
NM—1 idle; 1 unknown status
NV—1 in construction
Potential Production Capacity.
USDA assumes 0.3% of the 21 billion gallons of advanced
biofuel by 2022 (this is only for dedicated energy crops and woody biomass from logging waste).
Commercial scale algae production is not included.
Land Use.
In this region there is an acreage base of 29.7 million of cropland and cropland
pasture plus 48.9 million acres of forest land. While 64 million gallons from 49,800 acres of
dedicated bioenergy crops plus 442,600 acres of harvested logging residue in a year (does not
include potential from insect and disease damaged and dead trees that could be harvested) is a
potential, it is not counted as part of the RFS2.
V. INFRASTRUCTURE CONSIDERATIONS FOR THE EXPANDED USE OF BIOFUELS
There are a number of potential barriers and bottlenecks in the current ethanol use supply chain.
While we expect the market to respond to the infrastructure needs of a growing industry, we
recognize that the path from production to actual consumption presents challenges that will need
to be anticipated and addressed. For example, the vehicle fleet in the United States today
currently is not able to accept ethanol blends higher than 10% due to the technical challenge of
overcoming the ―blend wall‖.6 EPA is in the process of evaluating whether a decision to blend
up to 15 percent ethanol into gasoline is justifiable based on the latest science, its effect on
engines, and its effect on air quality. In addition, the only other fuel currently utilized by
vehicles on the road today is E85, which can be utilized in a flex-fuel vehicle (FFV). The limited
number of FFVs, their relatively low utilization of bio-based fuels instead of gasoline, and the
inability of the rest of the vehicle fleet to utilize higher blends, restricts the amount of ethanol
that can actually be consumed.
In conjunction with meeting the blend wall and FFV challenges, there is a need to evaluate
infrastructure needs to both distribute (rail and truck, blending terminals and storage) and
dispense fuel (blender pumps, refueling stations). These issues can affect decisions in siting
biorefineries, in addition to many other components such as feedstock availability, land and
water availability. Key among them are distribution concerns. For instance, biorefineries with
production capacity below 100 million gallons per year will likely depend on truck service to
deliver the feedstocks to the biorefinery and the fuel to market (petroleum blending terminal or
retail stations). However, if enough biorefineries are located in close proximity to each other,
rail service may be a viable option. For retail sales, the installation of blender pumps will be
necessary at the retail level to provide outlet of the product to the consumer.
We provide an assessment of current capacity including the availability of blender pumps and
transportation infrastructure.
Blender Pumps.
While the market will determine the ultimate need for blender pumps, this is
one area that USDA can immediately offer assistance on infrastructure, beyond the work USDA
Rural Development is already doing on biorefinery construction and upgrade loans and grants.
The number of FFV vehicles in service and locations of concentrations of these vehicles is a
good indicator of current blender pump needs. The number of Flex Fuel Vehicles (FFVs)
currently on the road is between 8.0 and 8.5 million. They constitute about 3.2 – 3.5 percent of
the approximately 250 million vehicles on the road. The map below shows the distribution of
FFVs by county (NREL), indicating the concentration of FFVs is mainly near the ethanol-
producing region.
6 Growth Energy has submitted a waiver request to EPA to allow E15. Archer Daniels Midland has requested EPA,
on the basis of substantially similar rationale, that E11/E12 be approved.
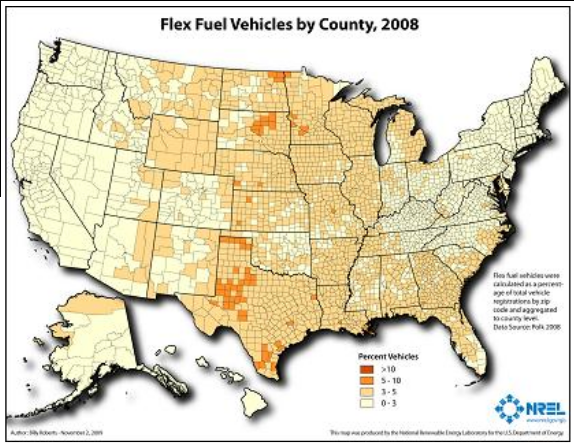
The bulk of the FFVs are located in the Midwest. However, see figure below, there is a demand
for ethanol outside the Midwest. Approximately 40 counties in Texas, 2 in Kansas, 3 in
Nebraska, 8 in South Dakota, 3 in North Dakota, 6 in Minnesota, and 1 in Missouri have a
concentration of FFVs in the 5 – 10 percent range. On a land density basis (FFV/5 sq. miles), the
FFVs are concentrated in the East and West Cornbelt and the Southern and Northern Plains
states. In the West Coast markets such as, California, Arizona, Washington, and Oregon and in
the Northeast states, however, there is an opportunity to increase the number of FFVs because
currently their share in those major markets is low.
The top five states in terms of FFVs are Texas, Florida, California, Michigan and Ohio and they
account for one-third of the FFVs (July 1, 2009). One point of information—due to the total
number of vehicles in the urban areas of California and Michigan—they are boosted into the top
five states in terms of FFVs.
The map below shows that California, Texas and Florida are the States with the highest
consumption of ethanol and may be the primary targets for blender pumps and flex-fuel vehicles.

According to the EPA, CFDC, RFA and NREL there is a wide range in the estimated cost to
install blender pumps. The range in costs is directly attributed to whether existing pumps can be
modified or need to be replaced and whether Underground Storage Tanks (UST) need to be put
in or modified. If a station is currently selling E85, for instance, the pump could be modified so it
could pump fuel from the E85 tank and an E10 tank to deliver an alternative blend.
The cost for a standard fuel dispenser is $14,000 (American Coalition for Ethanol - Lamberty)
and for an E85 dispenser $23,000. The cost of a blending pump would more closely match that
of an E85 pump. Each pump has two fueling positions. The EPA (RIA) estimates that if the
hoses on a dispenser needed to be replaced this could be done for $750 plus a $25 installation fee
(total cost of $775 per dispenser). If the wetted fuel dispenser components needed to be replaced,
this could be done for $10,000 (components) and an installation fee of $1,000. The total cost to
modify the standard pump would include hoses, wetted components and installation for an
estimated cost of $11,775.
EPA estimates that the average cost to install a new tank and above ground E85 dispensing
equipment is $122,000 per retail station. Fueling facilities can install an E85 pump and net out
the cost with the tax credit for infrastructure, but, it is only for the E85 portion of the pump. The
tax credit was originally 30 percent or $30,000 of the cost of infrastructure (tanks, pumps, etc.);
in 2009 was increased to 50 percent or $50,000. This tax credit is set to expire at the end of
2010.
If facilities need to break cement or ground to modify pipes, tanks or add tanks, EPA estimates
the cost to average $25,000 – facilities that require more extensive UST modification would cost
more, while those requiring less work would cost less. Assuming the blender pump costs are
similar to E85 and the potential underground work, the cost could rise to more than $50,000 for
one blender pump installation. Multiple pump installations at one facility would spread the
underground work cost across more pumps. An NREL 2008 survey of 120 stations found that
the median cost to add a new tank was $59,000.
These figures indicate that the cost to install blender pumps can vary widely which means that
the support necessary for this process must be flexible. In addition to federal support, some
states provide support to offset some of the installation costs to the fueling stations in installing
blender pumps. Growth Energy began a program recently that offers up to $5,000 to help defray
the costs of procurement and installation.
A number of states have incentives designed to stimulate consumption of biofuels. A state by
state listing is not possible at this time, but USDA is in the process of compiling one, with the
help of the states. The incentives could include: industry recruitment incentives, corporate tax
credits, net metering policies, grants, loan programs, rebate programs, personal tax credits, sales
tax exemptions, property tax exemptions, and production incentives. However, more than half of
the states provide some E85 production and/or sale encouragement.
Rail and Trucking Infrastructure.
Current conditions for ethanol distribution should guide us
in evaluating potential gaps in infrastructure needs as biofuels supply increases and demand
responds as it becomes more widely available and competitive with other fuels. Ethanol
consumption has followed a gradual regional development. Most of ethanol is distributed by
rail, but only about 15 percent of petroleum blending terminals that handle ethanol have rail
access—most are serviced by pipelines for petroleum products and trucks for ethanol. The map
below shows the current patterns of ethanol distribution.7 It shows the concentration of rail
corridors from the producing area in the Midwest to the consumption areas along the coasts. It
also identifies the location of all ethanol blending terminals.
7 For a more in-depth look at biofuel transportation, please see Chapter 4 of the USDA/DOT Study of Rural
Transportation Issues: http://www.ams.usda.gov/AMSv1.0/RuralTransportationStudy
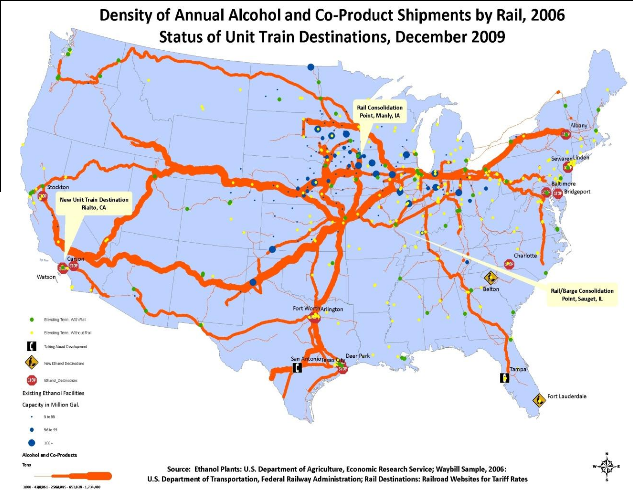
Based on a model developed by Oakridge National Laboratories, EPA projects that 40 unit train
rail receipt facilities will be needed to distribute additional volumes of ethanol as targeted by the
RFS2. Additional unit-train destinations would likely create more ethanol corridors on the rail
network, possibly alleviating congestion points that could develop with increased biofuel
shipments. In addition to unit trains, EPA expects manifest rail cars (shipments of less than 80–
100 railcar unit trains) will continue to be used to ship ethanol and cellulosic biofuels. EPA
estimates the capital costs for the ethanol distribution infrastructure would total $12.066 billion.
When amortized, this translates to 6.9 cents per gallon of additional costs associated with
shipping RFS2-related volumes of ethanol. Developing unit train destinations is a time-
consuming process, usually taking 3 to 5 years. The industry has responded to this challenge by
developing rail-to-truck transloading facilities for smaller-than-unit train shipments of ethanol.
X. CONCLUSIONS
This report was intended to start compiling real world data that would indicate the size and scope
of the investments necessary to achieve 36 billion gallons of renewable biofuels by 2022. What
USDA has shown in this report is:
(1) A rapid build-up in production capabilities is needed to meet the RFS2 targets for cellulosic
biofuels.
(2) The scope of the monetary investment for biorefineries is substantial.
(3) It is important to consider both sides of the market – the production/supply side and
mandate/consumption side – and how they respond to the RFS2 mandate.
(4) There are current infrastructure needs, in the form of blender pumps and rail and trucking
infrastructure which are in varying stages of being addressed by the market, though a careful
assessment of barriers to their development is needed.
(5) The U.S. farm sector is capable of producing a diverse complement of feedstocks to make the
biofuels industry a truly national effort.
(6) In addition, a process for identifying bottlenecks and barriers related to locating biorefineries
involving the federal government, Congress, states, the industry and interested stakeholders
can help facilitate a biorefinery system that is national in scope.
USDA intends this report to provoke discussions and looks forward to further work on this issue
which may prove to be one of the most important of the 21st century.
Contributors to this Report:
Sarah Bittleman OSEC
Meg Bolin RD
Bill Hagy RD
Velma Charles-Shannon ASCR
Renee Schwartz FAS
Jeffrey Steiner OCS
Tony Crooks RD
Bill Smith RD
Todd Atkinson FSA
Lynn Tjeerdsma FSA
Chavonda Jacobs-Young OCS
Ross Braun NRCS
Marilyn Buford FS R&D
Karen Larsen RD/RUS
Chris Nelson OBPA
Paul Trupo FAS
Harry Baumes OCE/OEPNU
Marina Denicoff AMS
Quinton Robinson OSDBV
Todd Campbell RD
19
USDA Biofuels Strategic Production Report
June 23, 2010
APPENDIX A.
Current Status of Biofuel Production in the United States
A. Ethanol
Currently, ethanol, from corn grain, and biodiesel, from soybean oil, animal fats, or restaurant
greases, are the only biofuels produced in the United States on a commercial scale. In the US,
there are currently 201 ethanol and 168 biodiesel facilities in production. The majority of this
biorefineries are located in the Central Eastern region of the country, comprised of Iowa,
Nebraska, Illinois, Minnesota, South Dakota, Indiana, and Ohio. Corn starch ethanol is not
considered an advanced biofuel for the purposes of the RFS2 standards and can contribute a
maximum of 15 billion gallons to the RFS2 targets.
Based on regional agronomic conditions, the Central Eastern region of the United States bears
the greatest potential for expansion in addition to the current production, followed in order by the
Southeast, Northwest, Northeast, and West, with the West projected to contribute less than 1% of
the goal of 21 billion gallons of advanced biofuel by 2022.


