Submitted by Norm Roulet on Thu, 10/14/2010 - 13:00.
In honor of the Reclaiming Vacant Properties conference in Cleveland this week, I thought I would share some real reflections on why so much property is vacant in Cleveland - lead poisoning... which impacted the whole world but has caused especially pronounced harm in Northeast Ohio, continuing today.
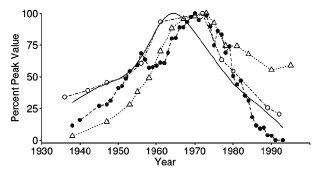
Comparison of relative temporal changes in lead concentration in tooth enamel and lake sediments, and relative changes in the total amount of lead additives to gasoline. Maximum absolute values and symbols are: 4.94 μg/g (teeth, smoothed data, uninterrupted line), 72.7 ppm (“new core Lake Erie sediment, triangles), 41.1 ppm (Graney et al., 1995 Lake Erie sediment, open circles), and 253,000 mt of lead additives to gasoline produced in the US, closed circles (see Methods).
While I don't recall it being reported in Cleveland before, Thaindian News, of Bangkok, Thailand, reported, on June 16, 2010, Leaded gasoline chief culprit for 20th century neurological defects, which raises significant concerns about lead poisoning issues in Cleveland, Ohio, and America-wide, finding “It raises the question, has leaded gasoline had a lasting effect on many present-day Cleveland adults?” From Thaindian.com:
Leaded gasoline is to be blamed for nearly two-thirds of toxic lead ingested or inhaled by African-American children in Cleveland during the latter two-thirds of the 20th century, says a new study.
According to researchers from Case Western Reserve University, their findings probably apply to many cities across the US and reinforce concerns about the health threat for children in countries still using leaded gasoline.
However, they emphasize that the results do not minimize the ongoing importance of current childhood lead exposure due to persistence and deterioration of leaded paint which was used as late as the 1960’s.
Extrapolation from lead analyses of teeth from 124 residents of urban Cleveland neighbourhoods show that “at the peak of leaded gasoline usage, in the 1960’s and early 70’s, the levels of lead in the bloodstream were likely to be toxic,” said Norman Robbins, emeritus professor of neurosciences at Case Western Reserve School of Medicine.
Research of others has shown that these levels of lead are associated with significant neurological and behavioural defects lasting into adulthood, he said.
“It raises the question, has leaded gasoline had a lasting effect on many present-day Cleveland adults?” Robbins said.
This study - Childhood lead exposure and uptake in teeth in the Cleveland area during the era of leaded gasoline - reports on a recent Case Western Reserve University-affiliated analysis of the lead burden of Cleveland children through the period when leaded gasoline was introduced and later phased out (from about 1930 to 1990), surfacing critical implication. The conclusions explain much about Cleveland's past and present conditions - and the conditions of our citizens - and raise significant concerns for Cleveland's future, which community leaders and government must address at all levels, to the White House... regarding lead poisoning in Northeast Ohio from the 1930s to now:
- The extrapolated peak level of 48 μg/dL (range 40 to 63) is associated with clinical and behavioral impairments, which may have implications for adults who were children during the peak gasoline lead exposure.
- It is likely that still greater changes would be expected in contemporary African-American adults, 25–40 years old in 2010, whose teeth showed the equivalent of a PbB of 48 μg/dl at the peak of lead uptake from leaded gasoline
- In the 1976–1980 national studies (Mahaffey et al., 1982), PbB in white urban children was 75% of that in African-American urban children, an estimated peak PbB of about 36 μg/dl might be expected in the former group.
- A PbB level of 48 μg/dl (corresponding to the maximum lead values found in teeth) would be associated with neuropsychological, behavioral and patho-physiological deficits (Lidsky and Schneider, 2003; ATSDR, 2007), and many children undoubtedly had far higher levels than the mean.
- Wright et al. (2008) found over 2.5 fold increases in juvenile arrests for violent crimes for children with mean PbB of only 26 μg/dl
- Dietrich et al. (2001) found increases in later delinquent and antisocial behaviors related to high childhood lead levels (their highest values were about 34 μg/dl)
This is the first study I've seen analyzing lead concentration and 207Pb/206Pb isotope ratios in the enamel of permanent molar teeth to determine historical trends in lead poisoning from the use of leaded gasoline... concluding "leaded gasoline emission was the predominant source of lead exposure of African-American Cleveland children during the latter two-thirds of the 20th century."
However, exposure to lead from gasoline was only one factor of many poisoning Clevelanders through the 1990s... may of which are still poisoning a large percentage of Cleveland residents with lead dust today:
- Facchetti (1989) reported that airborne lead contributed only 24% to PbB (bone and non-atmospheric sources contributing the remainder)
- Leaded paint was used in most housing until the 1940s (Weaver, 1989) and in a substantial number of houses until about 1960 (President's Task Force, 2000; Jacobs et al., 2002)
- Iin much of the Cleveland population of this study, such housing was not substantially replaced over the next 30 years.
- in the period of interest between 1936 and 1993, most tooth donors lived in pre-1961 homes with significant lead paint hazards
- Another source of exposure was atmospheric lead emission from coal or ore smelting, which apparently reached a maximum around 1910, after which it was more or less constant at least until 1985.
- Solder in food cans, said to account for 20–30% of dietary lead intake (US EPA, 1977; US EPA, 1986), could also have been a major source of lead uptake.
- In the US, canned infant milk had high levels of lead until the 1970s (Jelinek, 1982) and 90% of food cans were lead-soldered as late as 1979, declining to 6% by 1988 (Bolger et al., 1992)
After leaded gasoline had been largely outlawed in America, in 1995, around 25% of Cleveland children had confirmed blood lead levels greater than 15 μg/dl... showing how great our lead burden was and is here, beyond the leaded gas days.
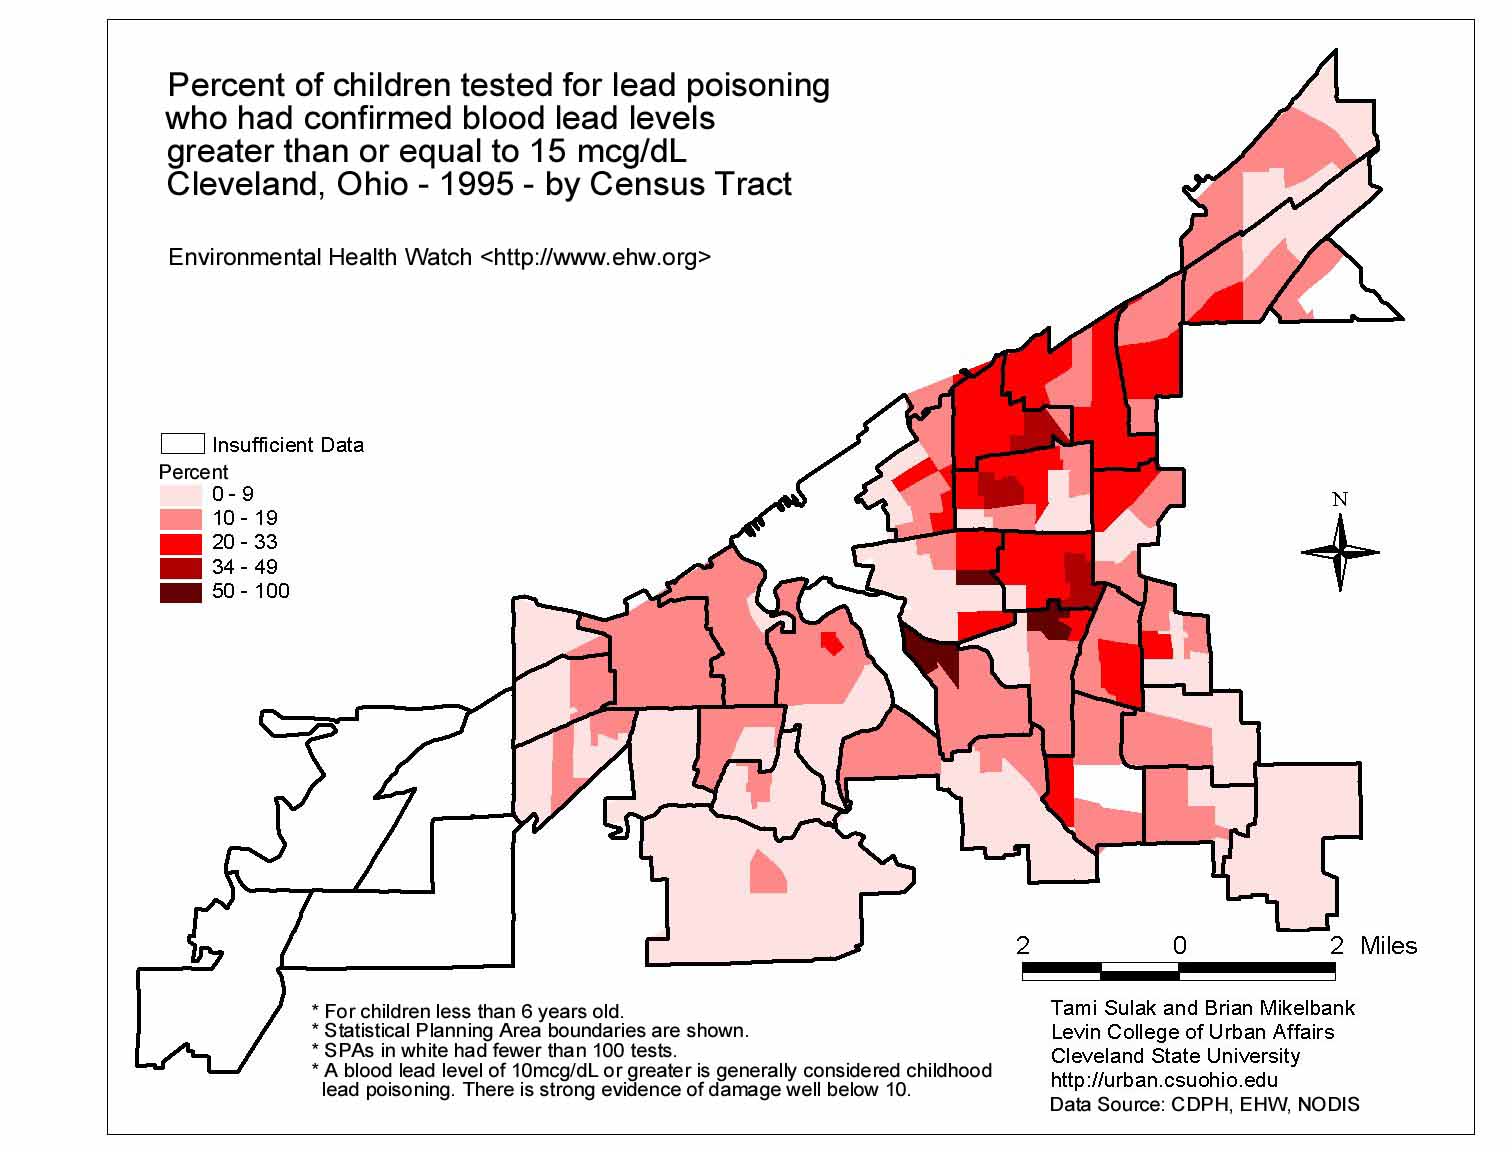
And, as of 2008, from Environmental Health Watch:
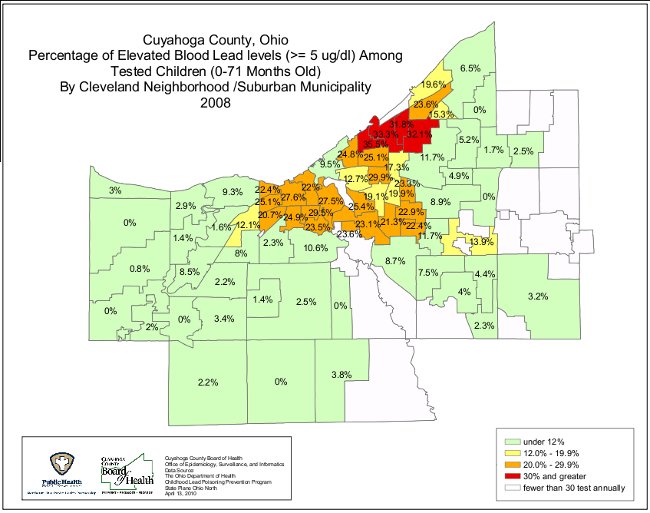
Cleveland and Cuyahoga County Childhood Lead Poisoning Rates - 2008 (children under 6 years of age)
- Based on the CDC blood-lead level-of-concern (10 mcg/dl), 6.3% (956 children) in Cleveland were identified as lead-poisoned
- Based on the Cleveland/Cuyahoga County blood-lead level-of-awareness (5 mcg/dl), 21.7% (3,298 children) in Cleveland were identified as lead-poisoned,
- Of the 25,351 children in Cuyahoga County that were tested in 2008, 16.2% (3,951 children) were tested at levels of 5 mcg/dl and above.
- Of the 25,351 children in Cuyahoga County that were tested in 2008, 4.8% (1,174 children) were tested at levels of 10 mcg/dl and above.
- Lead poisoning and increased blood lead levels have permanent affects on the well-being and health of a child, regardless of the current blood lead level.
- Prevalence history of Cleveland including charts and maps dating back to 1995.
Making lead poisoning in Cleveland the worst in the nation... although other industrial cities have significant of issues with lead poisoning today and from the past:


Noting one study has found 2.5 fold increases in juvenile arrests for violent crimes for children with mean PbB of only 26 μg/dl, and studies have found increases in later delinquent and antisocial behaviors related to high childhood lead levels (their highest values were about 34 μg/dl), it is not surprising to see a map of violent crime in Cuyahoga County in 2010 reflects lead poisoning 15 years ago, and earlier... and crime maps 15 years from now shall reflect lead poisonings of today!
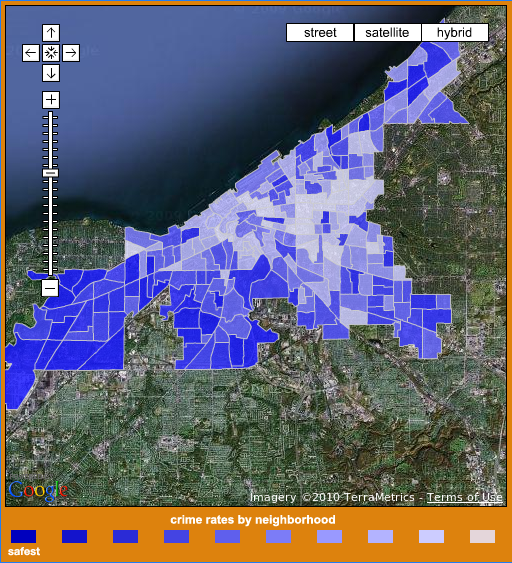
http://www.neighborhoodscout.com/oh/cleveland/crime/
And that is reflected in the following chart of Ohio prison population trends and forecasts, moving upward, being the final solution for the surge of lead poisoned prisoners since the peak
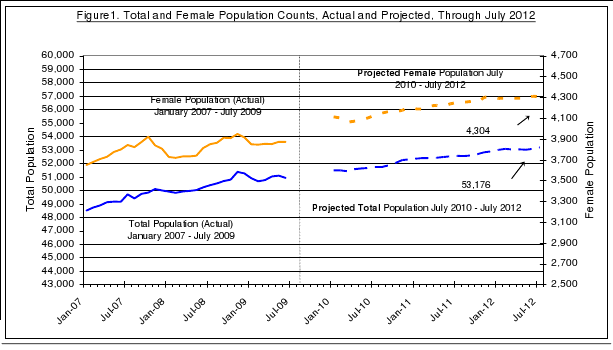
Figure 1 shows projected Ohio prison inmate population growth through July 2012 (Ohio Department of Rehabilitation and Correction, July 2009) - a result of lead poisoning in America - Wright et al. (2008) found over 2.5 fold increases in juvenile arrests for violent crimes for children with mean PbB of only 26 μg/dl - Dietrich et al. (2001) found increases in later delinquent and antisocial behaviors related to high childhood lead levels (their highest values were about 34 μg/dl)
I believe regular citizens would appreciate government using public funds to solve the real problems in America and the world today, like repairing humans, their lives and the Earth from the harm corrupt politicians and industrialists have caused covering the Earth in lead, as reflected in the chart at the top of this posting and below... Concentration of lead in tooth enamel at year of 50% enamel completion, 1938–1993.
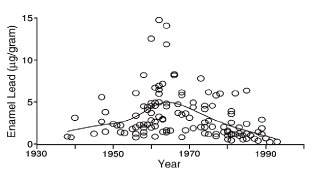
Concentration of lead in tooth enamel at year of 50% enamel completion, 1938–1993.
"Another source of exposure was atmospheric lead emission from coal or ore smelting, which apparently reached a maximum around 1910, after which it was more or less constant at least until 1985." - Childhood lead exposure and uptake in teeth in the Cleveland area during the era of leaded gasoline
With an AVERAGE extrapolated peak lead poisoning rate of 36 μg/dl for whites and 48 μg/dl for blacks born in the peak lead poisoning years of the 1960s through 1980s, now aged in our 20s-50s, Cleveland's urban population is expected to have exhibited "later delinquent and antisocial behaviors related to high childhood lead levels".
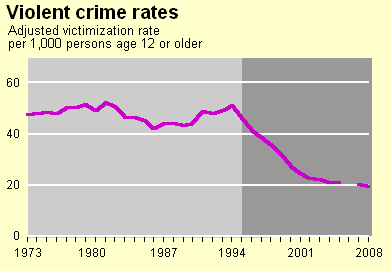
The violent crimes included are rape, robbery, aggravated and simple assault, and homicide.
It is therefore little surprise there was an unexpected increase in violent crime in America in the years trailing the era of peak lead exposure in Americans... with violence peaking 15-20 years after lead poisoning peaked, and declining in synch with the phasing-out of lead in canning, plumbing, paint and gasoline in America.
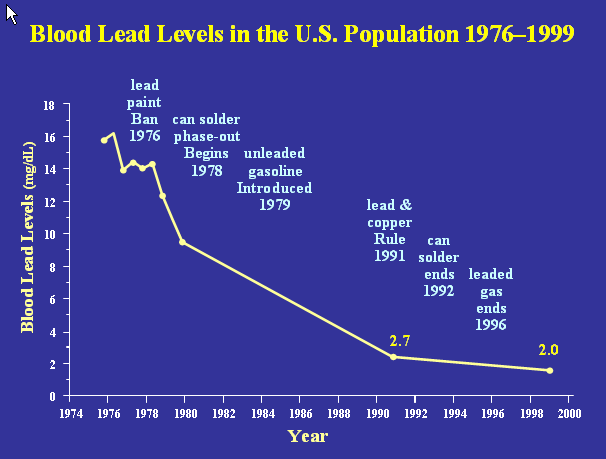
From Environmental Healthwatch
- The decrease in children's average blood-lead levels 1976-1999 is a major public health victory.
- How did this happen? Not by cleaning up the lead, but by eliminating the sources of lead – in paint, in gasoline and other products.
- Now that the major sources are removed however, clean-up of exposure pathways – lead-contaminated dust and soil and failed lead-based paint - is needed. This is much more costly and difficult because it must be done one house at a time. So the rate of decline is sure to taper-off and likely to stall.
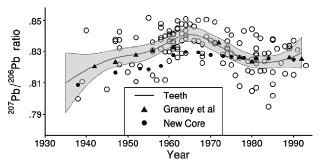
Fig. 4. 207Pb/206Pb isotope ratios in teeth and lake sediments during the course of leaded gasoline introduction, peak, and phase-out. The line and shaded area for tooth isotope ratios is the smoothed average +/−one standard error, and the open circles are individual tooth data points. The error bars on the individual lake sediment data points (not shown) were approximately the same size as the symbols.
Homocides peaked throughout America from the early 1970s-1990s. Since 1994 - around 15 years after leaded paint was outlawed and "unleaded" gasoline was introduced - violent crime rates have been declining.

American homicide rate over the last century-plus
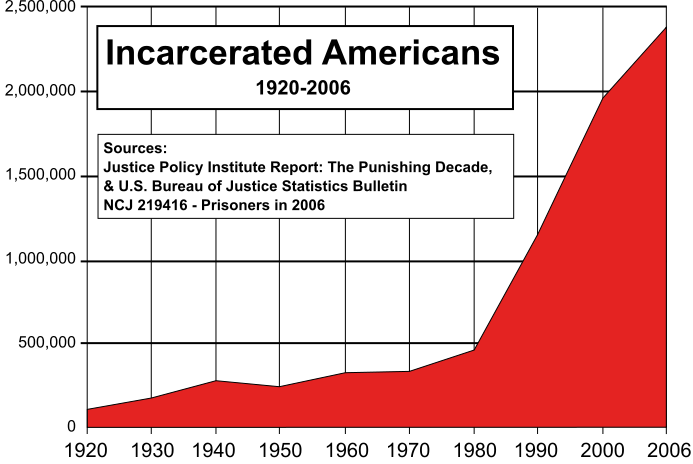
Where a large percentage of those 1960s-1980s lead poisoning victims have spent their adult lives is in prison, having been arrested for their "later delinquent and antisocial behaviors related to high childhood lead levels".
A PbB level of 48 μg/dl (corresponding to the maximum lead values found in teeth) would be associated with neuropsychological, behavioral and patho-physiological deficits (Lidsky and Schneider, 2003; ATSDR, 2007), and many children undoubtedly had far higher levels than the mean. For instance, in one study, there was a linear relation between childhood PbB and loss of brain volume (the highest PbB reported being about 32 μg/dl, Cecil et al., 2008), and in another study, children with PbB's at age 5 of 25 μg/dl showed a 16-point deficit in IQ (Chen et al., 2005). Again, children with tooth leads that would be equivalent to 35.5 μg/dl PbB had significantly higher difficulty with verbal and auditory processing, attention (reaction time) and dysfunctional classroom behavior (Needleman et al., 1979). Still, in one prospective study of children with PbB levels of 30–40 μg/dl from ages of about 1 through 7, smaller residual changes in IQ and other behavioral measures were found (Wasserman et al., 1997). Nevertheless, in other possibly related prospective studies, Wright et al. (2008) found over 2.5 fold increases in juvenile arrests for violent crimes for children with mean PbB of only 26 μg/dl, and Dietrich et al. (2001) found increases in later delinquent and antisocial behaviors related to high childhood lead levels (their highest values were about 34 μg/dl). Similar conclusions were also reached using environmental data on childhood exposure (Nevin, 2000, 2007). Therefore, it is likely that still greater changes would be expected in contemporary African-American adults, 25–40 years old in 2010, whose teeth showed the equivalent of a PbB of 48 μg/dl at the peak of lead uptake from leaded gasoline.
These facts make this an unsafe and undesirable place to be today, whether you are lead poisoned or not, explaining why we have so much vacant property in the region today.
Their conclusion that "in sum, leaded gasoline emission was the predominant source of lead exposure of African-American Cleveland children during the latter two-thirds of the 20th century", coupled with the realization this is not a race-issue but a socio-economic issue, harming all races and classes, gives all Americans reason for concern today... and is cause for alarm among those now living in urban communities most harmed by lead throughout the century... "still greater changes would be expected".
Childhood lead exposure and uptake in teeth in the Cleveland area during the era of leaded gasoline
Norman Robbins a,⁎, Zhong-Fa Zhang b, Jiayang Sun b, Michael E. Ketterer c,
James A. Lalumandier d, Richard A. Shulze d
a. Department of Neurosciences (Emeritus), Case Western Reserve University, Cleveland, Ohio, 44106-4975, USA
b. Center for Systems and Computational Biology, The Wistar Institute, Philadelphia, Pennsylvania, 19104, USA
c. Department of Chemistry and Biochemistry, Northern Arizona University, Box 5698, Flagstaff, Arizona, 86011-5698, USA
d. School of Dental Medicine, Case Western Reserve University, Cleveland, Ohio, 44106-4905, USA
a b s t r a c t
Childhood uptake of lead from exposure to atmospheric leaded gasoline in the United States has been
studied using mainly blood lead levels. Since reliable blood lead techniques were used only after the peak use
of leaded gasoline, the prior exposure history is unclear. The well-documented decline in blood lead levels
after the mid-1970s could represent the continuation of a historic steady decline in exposure from many
sources. Alternatively, the post-1970s decline might represent the declining phase of a unimodal rise and fall
corresponding closely to usage of leaded gasoline. To assess these possibilities, lead concentration and
207Pb/206Pb isotope ratios were measured in the enamel of permanent molar teeth formed between 1936
and 1993 in mainly African-American donors who grew up in the Cleveland area. Tooth enamel preserves the
lead concentration and isotope ratio that prevails during tooth formation. Historical trends in enamel lead
concentration were significantly correlated with surrogates of atmospheric lead exposure: lead in sediments
of two dated Lake Erie cores, and lead consumed in gasoline. About two-thirds of the total lead uptake into
enamel in this period was attributable to leaded gasoline, and the remainder to other sources (e.g. paint).
Enamel 207Pb/206Pb isotope ratios were similar to those of one lake sediment. Multivariate analysis
revealed significant correlation in neighborhoods with higher levels of traffic, and including lake sediment
data, accounted for 53% of the variation in enamel lead levels. Enamel lead concentration was highly
correlated with reported African-American childhood blood levels. The extrapolated peak level of 48 μg/dL
(range 40 to 63) is associated with clinical and behavioral impairments, which may have implications for
adults who were children during the peak gasoline lead exposure. In sum, leaded gasoline emission was the
predominant source of lead exposure of African-American Cleveland children during the latter two-thirds of
the 20th century.
© 2010 Published by Elsevier B.V.


Why Cleveland area leaders are failures
Why Cleveland area leaders are failures - they were severely lead poisoned in life, and are mentally incompetent.
Same applies to most citizens here... hence electing mental retards.
Simple as that.
I look forward to this being solved now by Dan Molthrop (he wouldn't touch the lead poisoning issue while he was at Ideastream... or was not allowed...) and Civic Commons - cost... just a cool $3 million more lead poisoned dollars and all our problems will be gone!
Thank you for your funding, Sherwin Williams, Jones Day.... Cliffs... Cleveland Thermal... Mittal... The Clinic... Case... University Hospitals!
A world healthcare leader... give me a break!
Ya'll really fucked this place and its people up!
To those poisoned, like my family... be mad as hell and do something about it.
Disrupt IT
How do you educate a lead poisoned child in Cleveland?
How do you educate a lead poisoned child in Cleveland?
You don't.
I've asked enough education leaders in the region to take action about lead posioning and none care about this issue - complete denial.
Complete guilt.
Disrupt IT
What issue is more important to county executive candidates?
How do you eradicate Lead Poisoning? You elect good leaders who make that a priority.
Lead poisoning is preventable, but not easy to prevent. The issue must be addressed with urgency.
There is no urgency to address this issue in this region of Ohio.
What issue is more important to county executive candidates?
Disrupt IT
OUR LEADERS ARE LEAD POISIONING....
They are the lead that keeps us down and the poison that ills us all locally! ERADICATE THEM and start with a fresh slate!!! Elect Don Scipione as Cuyahoga County Executive to conquer these historical demons!
We do have leader poisoning
ERADICATE THEM
Disrupt IT
How do you give the public TRANSPARENCY & INVOLVEMENT?
Apparently, the public does not deserve to know what's being planned behind their backs????
PUBLIC REVIEW DRAFT (274 Page Power Point Presentation)...wow...TMI for the ignorant hillbillies!!!
82241 CUY IR090-17.90 RAMP CLOSED PE ODOT $1,000 2008
exempt
$1,000
Cleveland:
E 33 St & St Clair Ave to IR 90
Permanently close the eastbound IR 90 entrance ramp at St Clair
Ave and E 33 St
TRANSPORTATION IMPROVEMENT PROGRAM (TIP)
(SFY 2008 – 2011)
HIGHWAY, BIKEWAY AND TRANSIT ELEMENTS
MARCH 26, 2007
Prepared by
NORTHEAST OHIO AREAWIDE COORDINATING AGENCY
ROBERT .BROWN HOWARD R. MAIER
BOARD PRESIDENT EXECUTIVE DIRECTOR
The preparation of this publication was financed through grants received from the Federal Highway Administration and the Ohio
Department of Transportation and appropriations from the counties of and municipalities within Cuyahoga, Geauga, Lake, Lorain and
Medina. The contents do not necessarily reflect official views or policies of the U.S. Department of Transportation or the Ohio
Department of Transportation. This report does not constitute a standard or regulation.